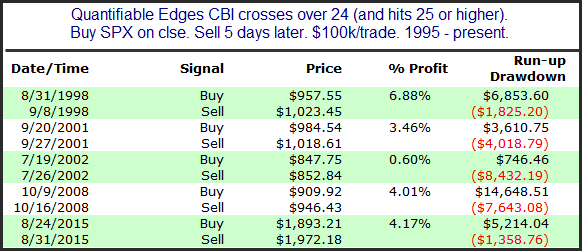
As I Tweeted out (@QuantEdges) as we approached the close yesterday, the CBI spiked on Monday from 6 to 25. Twenty-five is an extremely high number. And while readings that high have been rare, they have also been quickly followed by a bounce in the SPX. Below is the list of the 5 previous instances, dating back to 1995, and their 5-day returns.

You’ll note when looking at the dates they were all significant historical market events. Long-Term Capital, Post 9/11 attacks, 2002 crash, 2008 crash, and 2015 China-induced crash. Every instance bounced over the next 5 days, but 3 of them saw further declines between 4% and 8.5% before the bounce occurred. The message appears to be that the market is likely within a few days of a capitulative bottom, but price may have to fall further before the big reversal kicks in. And with XIV/SVXY news pending and possible implications not yet known, it could be a scary ride.
Want research like this delivered directly to your inbox on a timely basis? Sign up for the Quantifiable Edges Email List.
