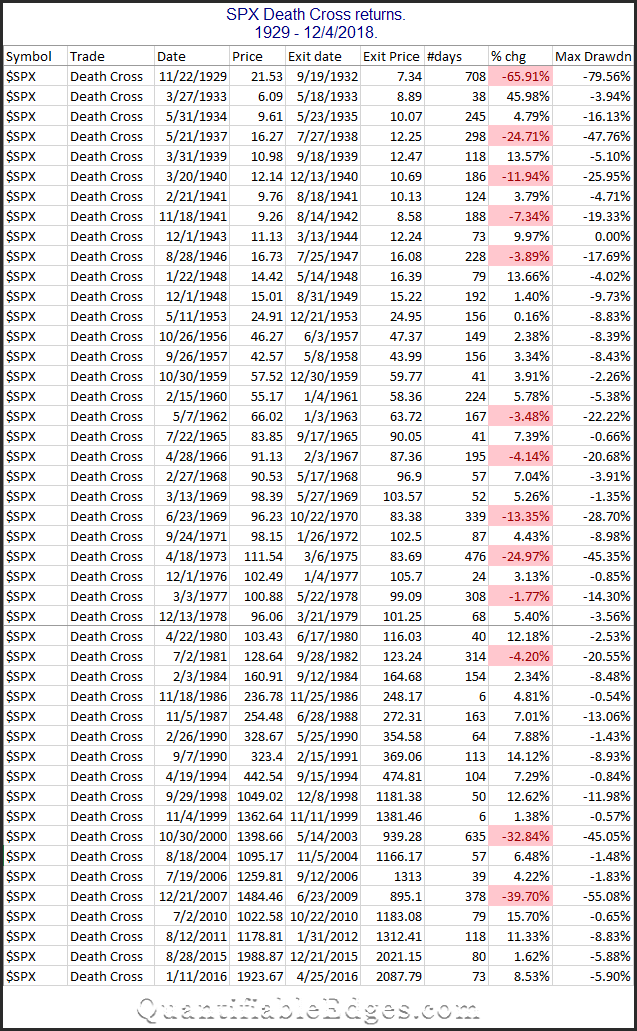
The SPX could complete a “Death Cross” formation today or tomorrow, in which the 50-day moving average crosses below the 200-day moving average. In the past I have looked back to 1960 when examining Death Crosses. This time I decided to use Amibroker with my Norgate database, which goes back to 1928, and examine Death Crosses back as far as I can. This made for an interesting starting point, because the 1st instance, in 1929, came shortly after the 1929 market crash that was followed by the Great Depression. It was also followed by the most substantial decline – by far. Let’s first look at a list of all the Death Cross formations and how the SPX performed while they were in effect.
Below are summary stats for the above trades.
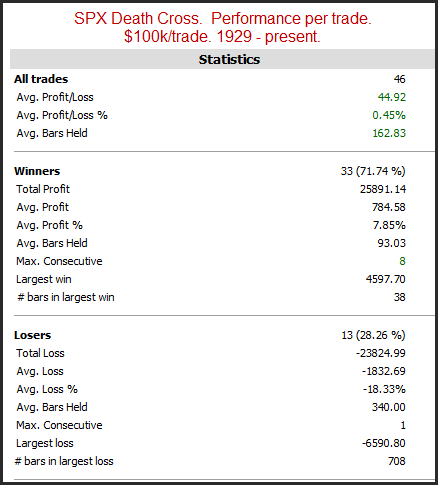
Interestingly, 33 of the 46 instances (72%) actually saw the SPX realize gains while the Death Cross was in effect. The problem is the losing trades were very large. And even most of the winners saw a sizable round-trip lower before they were able to carve out some gains. The average drawdown for these 46 trades would have been 13.3%. And there were 5 separate instances that saw drawdowns of at least 45%.
Even though the giant losers were relatively rare, their impact is large. And the fact that the 1st instance was the worst instance also provides a great example how devastating large drawdowns can be. The profit curve below shows a hypothetical portfolio of only being invested in the market during SPX Death Crosses.
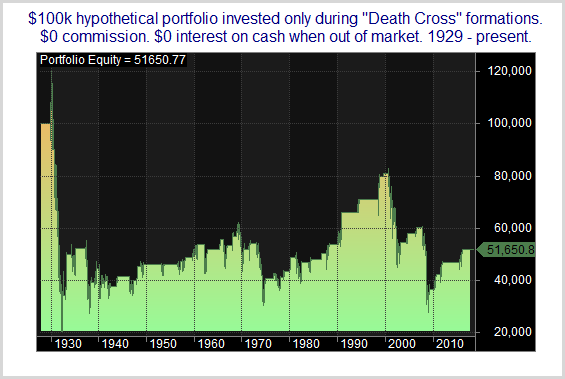
The 1st instance from 1929 – 1933 saw the portfolio rise to $120k before falling down as low as about $20k and then finishing that trade with a value of about $34k. And it has never managed to get back to breakeven. The 72% “win rate” on the Death Cross tells me it is NOT a reliable timing device. But the few instances of massive losses show just how valuable it can be to protect gains and avoid large portions of nasty bear markets. If we get into a big bear market, I won’t actually be sitting out of the market for several years. But it does allow traders to adjust strategies, exposure and other risk parameters. The Death Cross / Golden Cross on its own is not a great system. But it can help traders put the market into a context where they can better evaluate opportunities. And I have also found in helpful when combining with other timing indicators.
Note: The Quantifiable Edges Market Timing Course does look at the Golden Cross / Death Cross in combination with other timing indicators.
Want research like this delivered directly to your inbox on a timely basis? Sign up for the Quantifiable Edges Email List.