Stock market performance leading up to and around many holidays has often shown an edge. Holy Thursday is one day that has done quite well. I have shown Holy Thursday stats several times in the past. The chart and statistics below are all updated through last year.
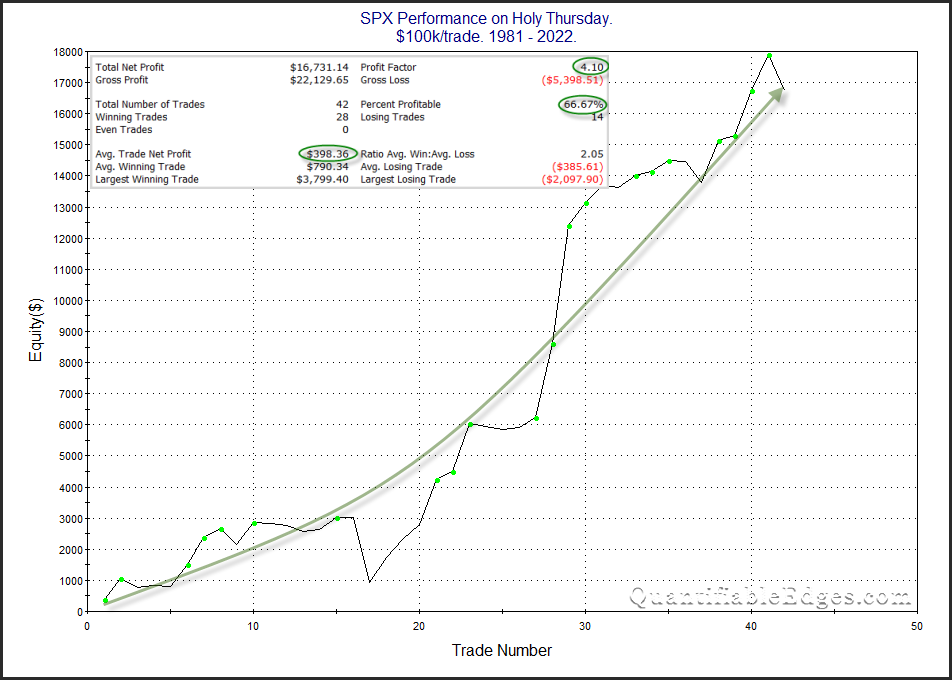
Despite closing lower last year, the stats and the curve are impressive, and suggest a bullish seasonal tendency. Traders may want to keep this in mind when setting their bias for Thursday.