I am seeing a number of studies that are suggesting the market is oversold and primed for a bounce. But there is one thing that concerns me about this selloff. That is the fact that the Quantifiable Edges Capitualtive Breadth Index (CBI) was still stuck at zero as of Wednesday’s close. Historically, the higher the CBI the better the chance of both a short and intermediate-term bounce when the market is making new lows. The studies below are from yesterday’s Subscriber Letter and they exemplify this.
The first one looks at performance following 50-day low closes when the CBI is 0.
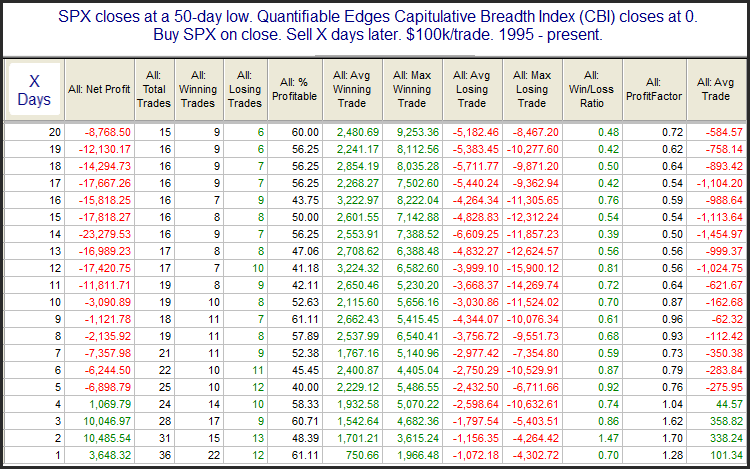
Other than perhaps a very quick bounce this has not been a favorable setup for the bulls. From 1-4 weeks out the results have all been net negative.
Now let’s look at instances where the 50-day was accompanied by a CBI of between 1-5.
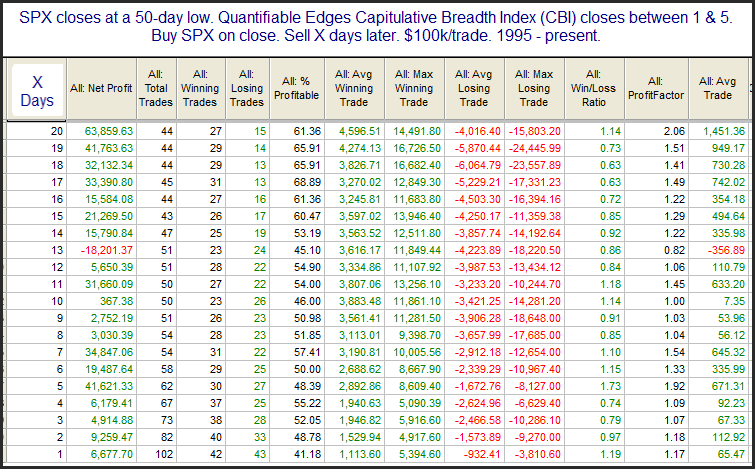
Still nothing I would want to place a strong wager on, but the results table has turned from mostly red to mostly green. So some improvement is certainly seen. Now let’s look at CBI readings between 6-9.
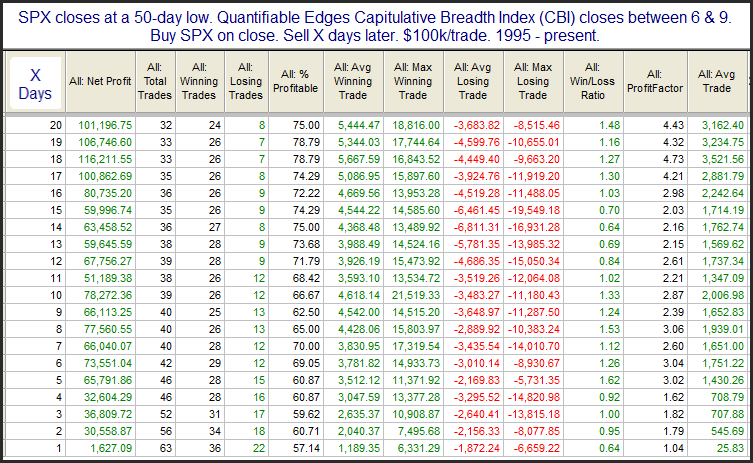
These are some solid bullish numbers. And the edge seems to persist from Day 1 and throughout the next 4 weeks. Lastly, let’s look at high CBI readings of 10 or above.
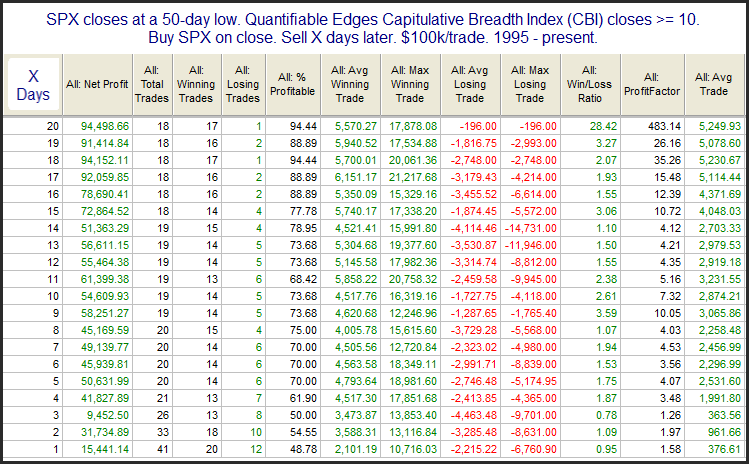
These are by far the most appealing results, from Day 1 right through day 20. And 20 days out there was just one loser and it only lost 0.2%. Of course we are not near this right now. We are in the first situation with a CBI of 0. The market is still capable of a rally. The probability is just not nearly as high. And that has me a little concerned.
Look for more on the CBI in the coming weeks!
Want research like this delivered directly to your inbox on a timely basis? Sign up for the Quantifiable Edges Email List.