Concerning about the current selloff is the fact that the Quantifiable Edges Capitualtive Breadth Indicator (CBI) remains at zero. Most subscribers understand that spikes in the CBI can often be a strong indication that a bounce is near. But a low CBI can also be a useful indication. The study below looks at other times SPX closed at a 20-day low and below the 200ma and the CBI posted a zero reading.
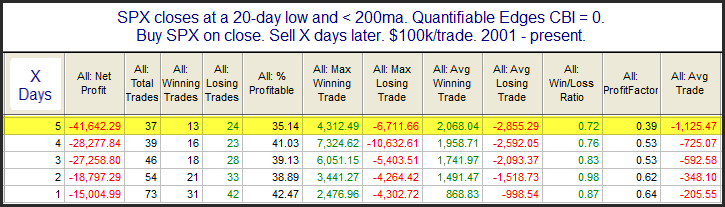
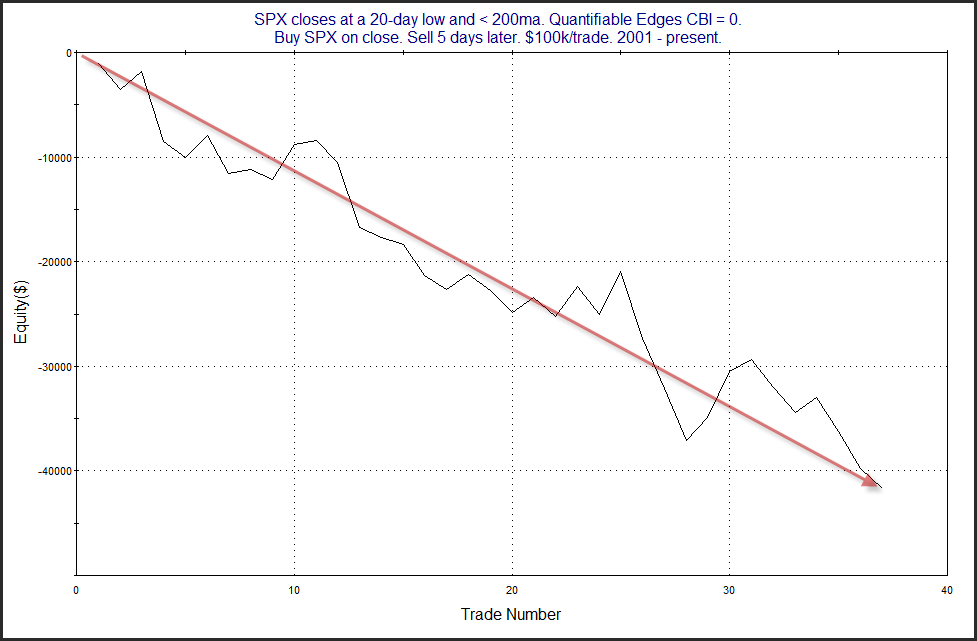
The lack of capitualtive selling seems to suggest there could be more selling to come before a bounce occurs. Below is a look at a profit curve assuming a 5-day holding period.
That is a strong & steady decline. To see how this contrasts with times the CBI closed above zero, I ran a couple of other tests. This next one requires readings of between 1-7.
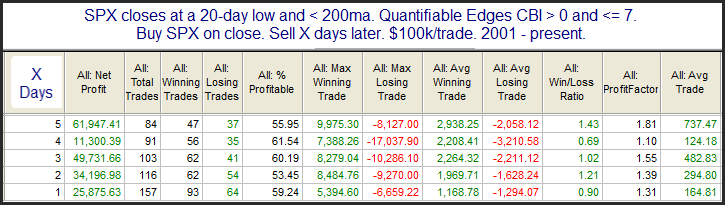
The red has turned to green in the Average Trade results. Instead of a downside edge, it appears there is a moderate upside edge. Of course the largest edges tend to occur when the CBI is giving high readings. The last study below looks at the same setup, but with a CBI over 7.
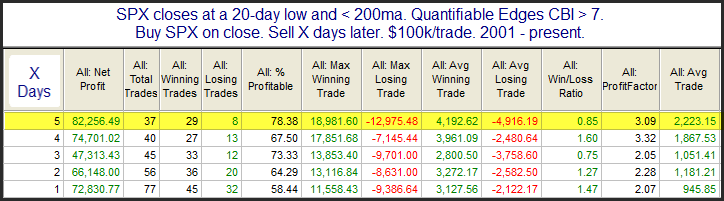
These results are strongly bullish. But this is not the current situation. The CBI of zero has us facing the first CBI study above, and that suggests more selling in the next week.
Of course the employment report that will come out before the open could trigger a large reaction either way. And we will also be faced with CPI numbers coming Tuesday. In other words, there is strong potential for large swings in either direction. This market has plenty of risk and I do not see a compelling indication that a bounce is highly probable at this point.
Want research like this delivered directly to your inbox on a timely basis? Sign up for the Quantifiable Edges Email List.
How about a free trial to the Quantifiable Edges Gold subscription?