Note: Later this week I will be having the annual “Black Friday” sale, which is the only sale I run during the year. If you think you might be interested in a subscription, then now might be a good time to take a free 1-week trial and see if Quantifiable Edges would be helpful for you. Also this week we expect to release the new Quantifiable Edges VIX Trading Course! More to come on that…
The time around Thanksgiving has shown some strong tendencies – both bullish and bearish. I have discussed them a number of times over the years. In the updated table below I show SPX performance results based on the day of the week around Thanksgiving. The bottom row is the Monday of Thanksgiving week. The top row is the Monday after Thanksgiving.
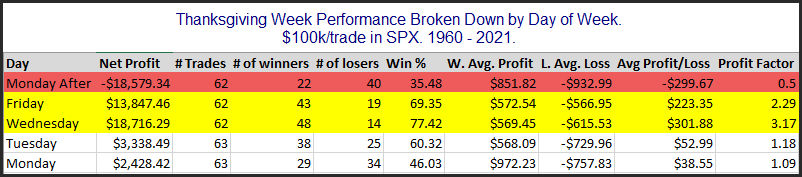
Monday and Tuesday of Thanksgiving week do not show a strong, consistent edge. But the data for both Wednesday and Friday looks quite strong. Wednesday has had the most consistent gains (77.4%), and the largest average p/l of 0.3% ($301.88 on $100k.) Friday’s stats look fairly impressive, but it has not performed nearly as well over the last dozen years as it had previously. Meanwhile, the Monday after Thanksgiving has given back a good chunk of the gains that were realized on Wednesday and Friday. The worst “Monday After” came in 2008 with a 9% 1-day decline. Since then, Monday After performance has been basically breakeven.
Want research like this delivered directly to your inbox on a timely basis? Sign up for the Quantifiable Edges Email List.
How about a free trial to the Quantifiable Edges Gold subscription?