The persistency of the rally over the last 3 months has been amazing. The chart below is of SPX. I have marked where the Fed announced the “not QE” program back in October. The blue line is the 10-day moving average of SPX.
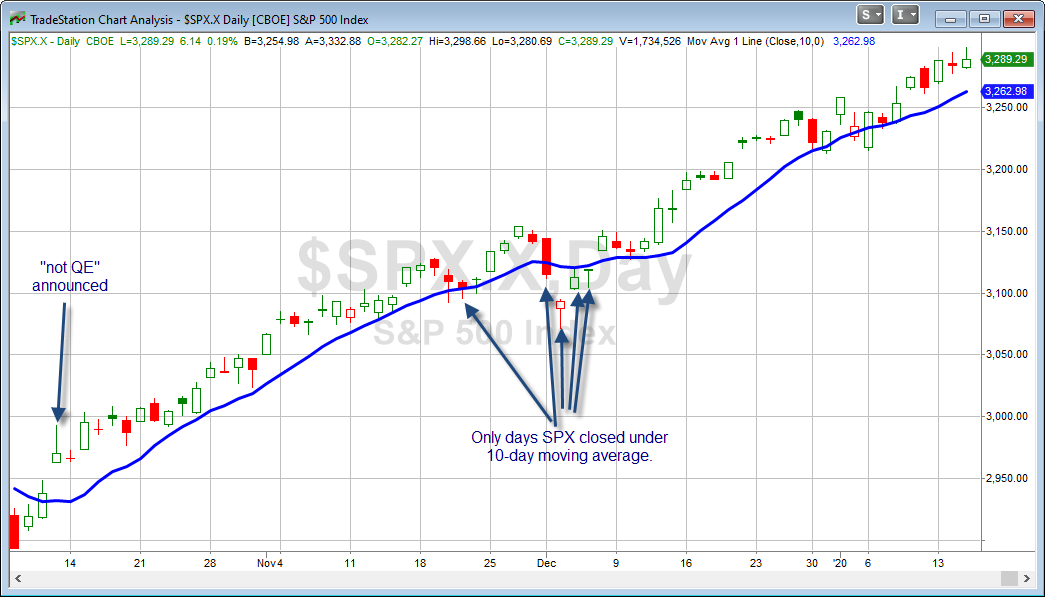
I have noted a few times lately that the market has gone an extended period without any closes below the 10ma. But what is more remarkable is how few days it has closed below the 10ma since “not QE” was announced on October 11th. In the last 67 trading days, there have only been 5 closes below the 10ma for SPX. There has not been a 67-day period with only 5 closes below the 10ma since 1972. And looking back to 1928 (when the S&P 500 was the S&P 90), there have only been 6 other instances: September 1929, July 1933, March 1943, June 1957, November 1965, and late February / early March of 1972. In other words, the persistency of this rally is extremely rare, and over the last 48 years, it is unheard of.
Note: The article above is an excerpt from last night’s Quantifiable Edges Subscriber Letter
Want research like this delivered directly to your inbox on a timely basis? Sign up for the Quantifiable Edges Email List.
Learn how to identify edges and formulate swing trading strategies with the Quant Edges Swing Trading Course!