The Quantifiable Edges CBI has spiked over the last few days. After closing at a basically neutral “4” on Wednesday, it rose to 6 on Thursday, and then posted an extra-large jump higher to 16 on Friday. In the CBI Research Paper I showed that a CBI total of 10 or more has generally been a bullish sign. But Friday saw the CBI rise by 10 points on just that day. That is a very strong 1-day change. Below I examined all other instances where the CBI spiked by at least 10 points in 1 day.
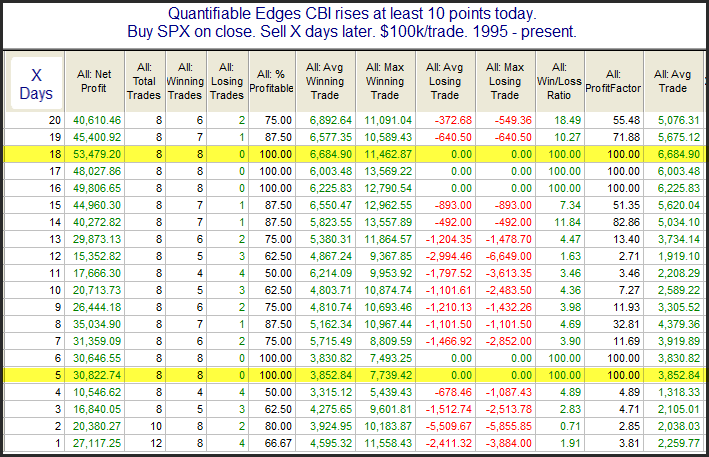
The setup is rare, but there are some very strong numbers here. Over the next week the average instance gained 3.85%, and the average 18-day % gain was 6.7%. Below is a look at all the individual instances.
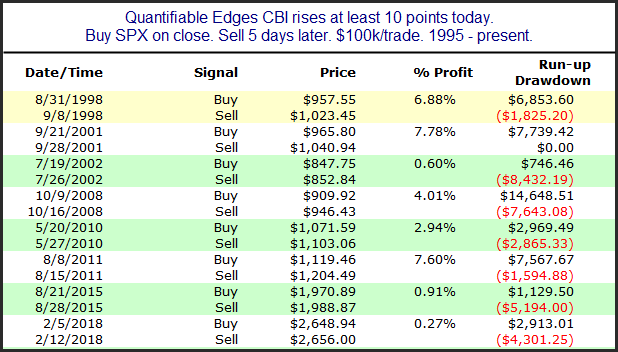
It appears the bounces have typically been strong, but they have not always been immediate. 2002, 2008, and 2015 all show some additional scary selling before the big reversal arrived. The CBI is suggesting a strong chance of a sizable bounce at some point this week. It may or may not begin on Monday.
Want research like this delivered directly to your inbox on a timely basis? Sign up for the Quantifiable Edges Email List.
Learn how to identify edges and formulate swing trading strategies in the new Quant Edges Swing Trading Course!