One indicator starting to give bullish readings is the Quantifiable Edges Capitulative Breadth Index (CBI). It reached 8 at the close on Thursday. While 10 is the level I often refer to as a very strong bullish indication, levels as low as 7 or 8 have often been followed by market bounces when the market has been in a long-term uptrend. Below I have produced a table showing results if you entered SPX long at differing CBI levels and then exited the position when the CBI returned to 3 or lower. (I consider 3 or lower to be neutral.)
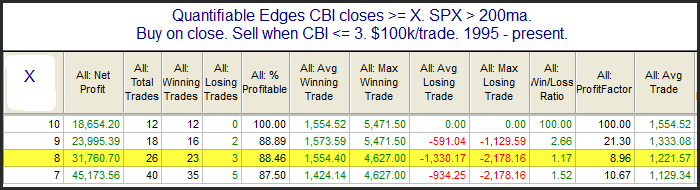
As you can see, results have been solid across the spectrum. The 8 level is highlighted since that is where we are at currently. Below is a profit curve of this strategy.
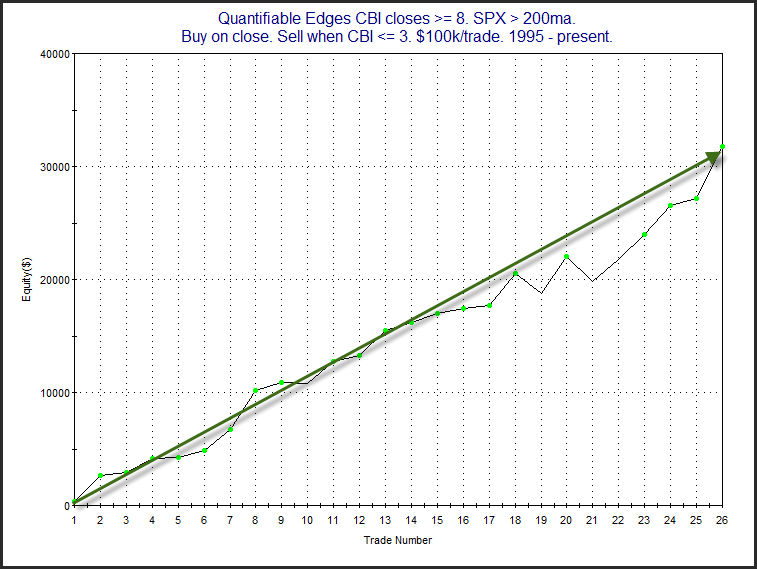
The strong, steady upslope increases confidence in the bullish edge.
A detailed description of the CBI can be found here. Or click here for more research related to the CBI.
Want research like this delivered directly to your inbox on a timely basis? Sign up for the Quantifiable Edges Email List.