Especially notable about Friday’s action was that the Quantifiable Edges Capitulative Breadth Indicator (CBI) rose to 11. This is the highest level it has been at since September of 2022. Below is a quick look at CBI readings over the last 2 years. I have shown dotted lines each time that it reached as high as 9.
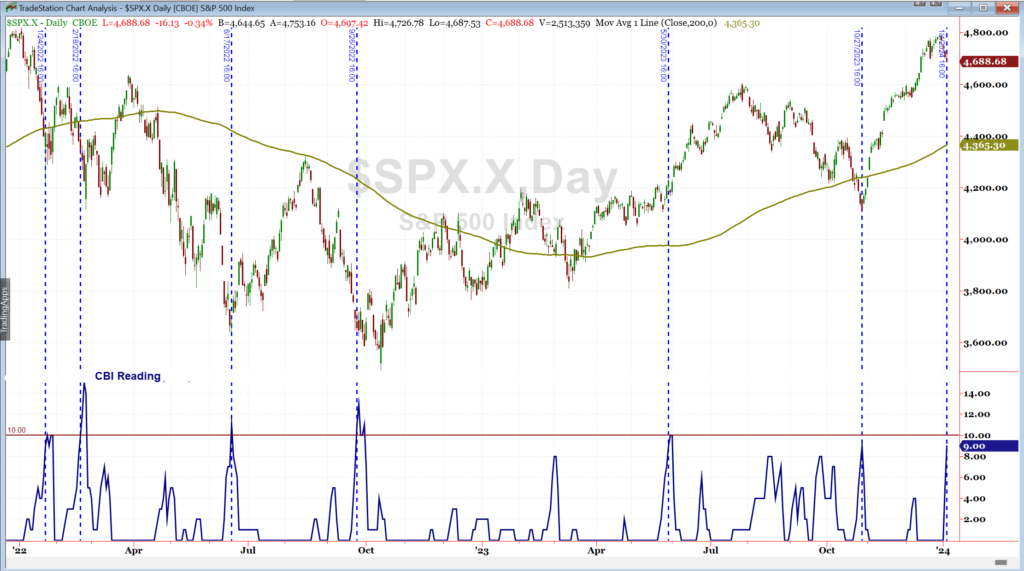
I have generally viewed 10+ as strongly bullish over the years. I have also shown in the past that readings of 11 or higher have been a bullish intermediate-term indication. This can be seen in the study below.
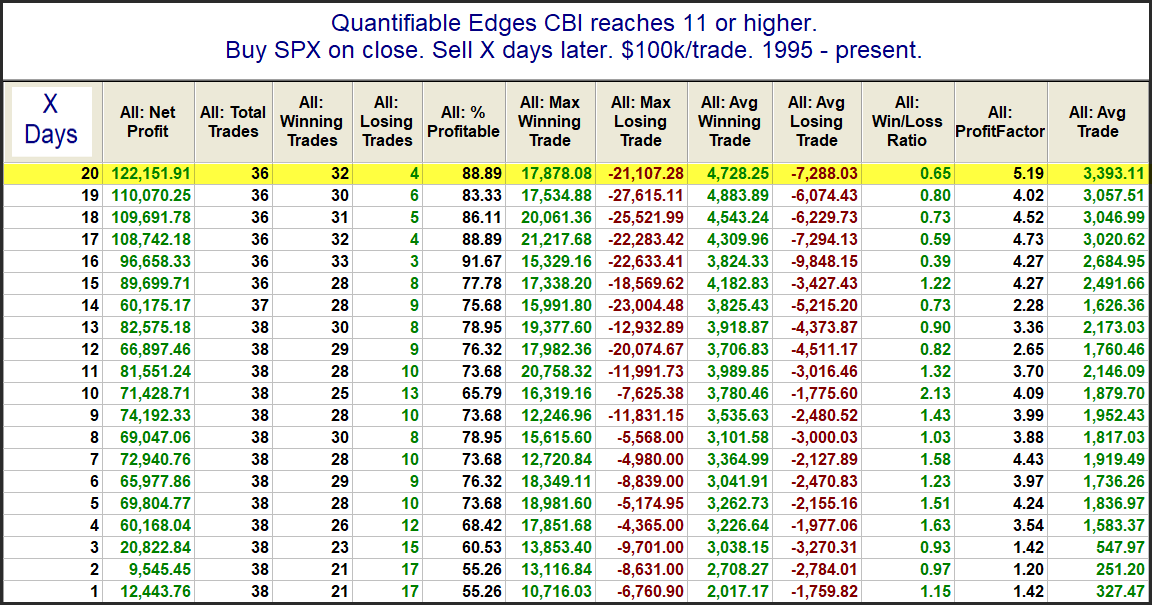
Looking out over the next several weeks, the stats are (almost) all very impressive. The one exception is the Max Losing Trade. That was thanks to the COVID Crash in March of 2020. Below is a profit curve using the 20-day exit strategy.
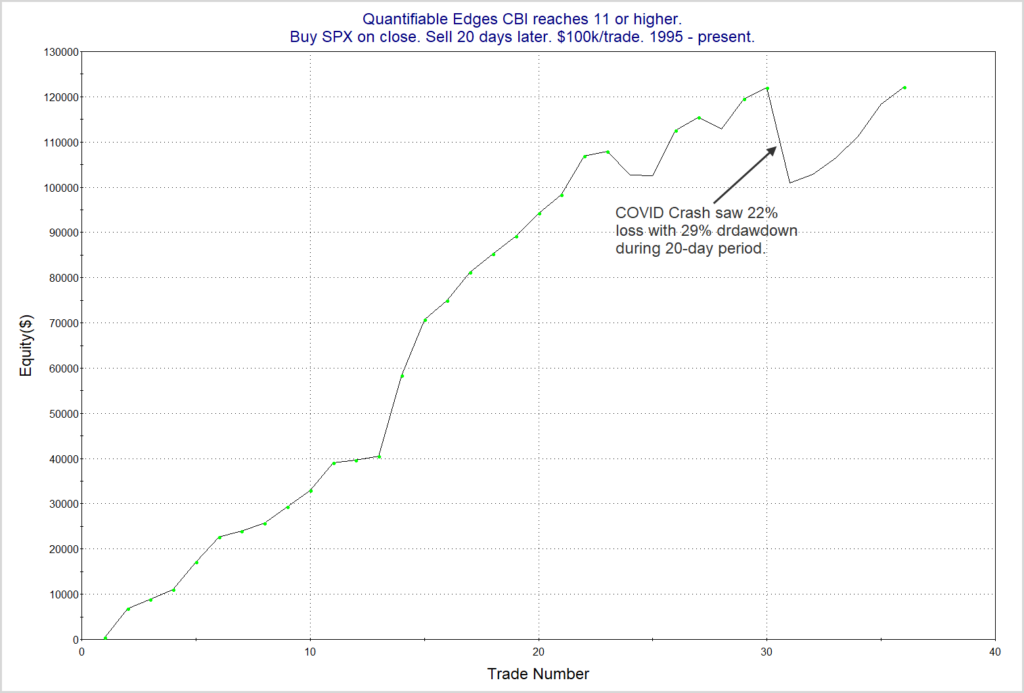
Even with the COVID Crash included, this study has made it back to new highs. Overall, I view the CBI spike over the last few days to be a favorable indication for both the short and intermediate-term.
Want research like this delivered directly to your inbox on a timely basis? Sign up for the Quantifiable Edges Email List.
How about a free trial to the Quantifiable Edges Gold subscription?