There is a seasonal influence that could have a bullish impact on the market this week. Op-ex week in general is pretty bullish. March, April, October, and December it has been especially so – at least until last March. S&P 500 options began trading in mid-1983. The table below is one I have shown and updated basically every year since 2008. It goes back to 1984 and shows op-ex week performance broken down by month.
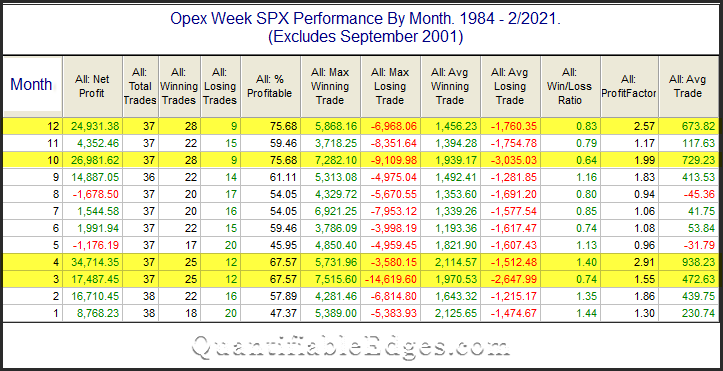
March has a strong win rate, but the gains are not as high as the other highlighted months. Some people may recall that March used to have the largest average trade of any month. The table below is the one from last year.
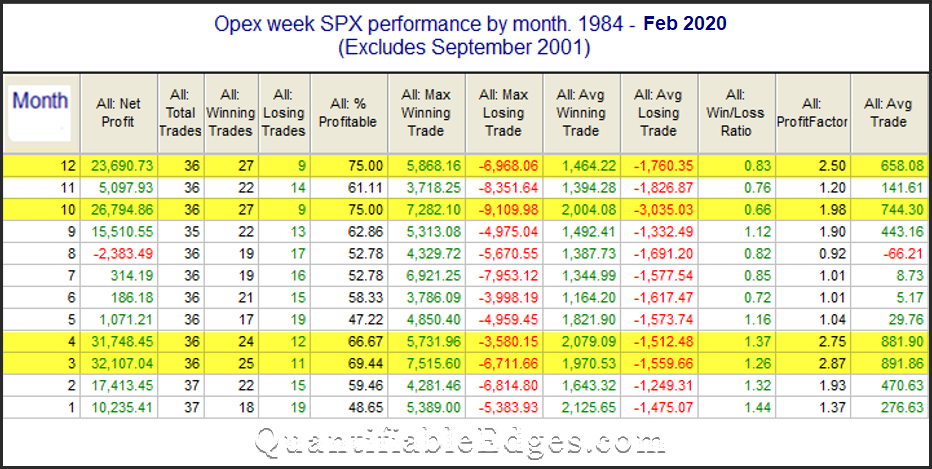
So how did the average trade change so much? March 2020.
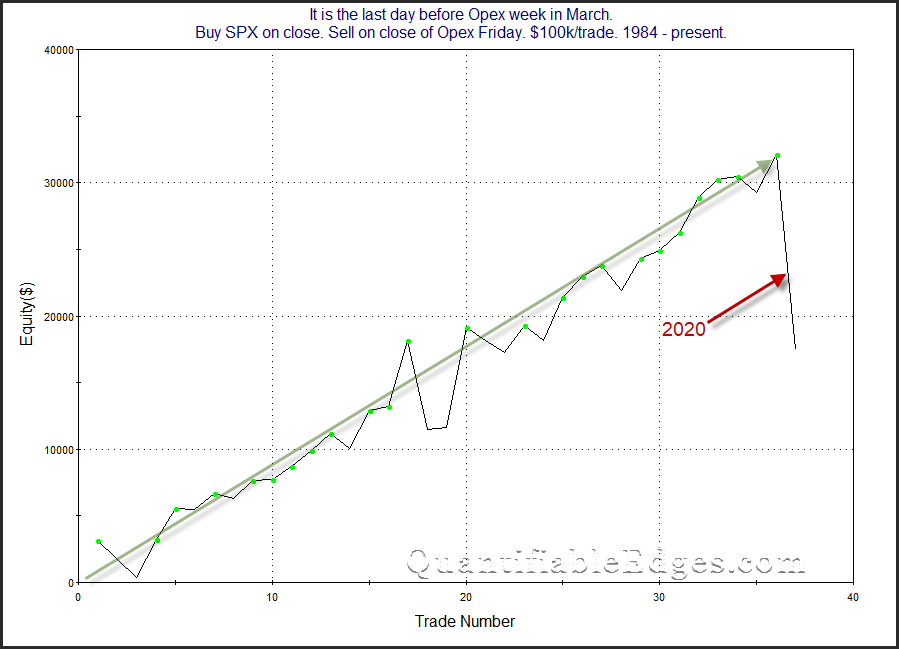
Last year really changed the look of the curve in a big way. A 1-week decline of 15% will do that. It is most likely just an outlier, and March opex still seems to offer a potentially bullish seasonal opportunity. But the historical stats sure weakened a substantial amount.
Want research like this delivered directly to your inbox on a timely basis? Sign up for the Quantifiable Edges Email List.
How about a free trial to the Quantifiable Edges Gold subscription?