October is a month that is known for volatility. And that is a well-earned reputation. Crashes in 1929, 1987, and 2008 all occurred in October. But volatility cuts both ways. If you break the year down into 1-week periods, October also contains some of the strongest seasonal edges of the year. There have been some very big swings in October, and not just by Mr. October.

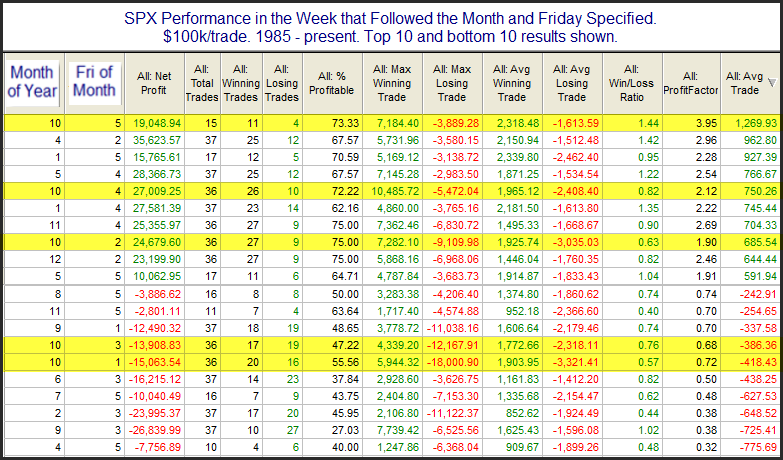
Breaking the year down by week is something I have done numerous times over the years, and it has provided some interesting insights. The table below shows stats back to 1985. I chose 1985 as the start date because SPX options trading began in 1984, so 1985 is the 1st full year where there was an options expiration schedule. Action on and around options expiration, which occurs on the 3rd Friday of each month, seems to generate some seasonal tendencies. So this study encompasses the full range of time that SPX options have been in existence.

You’ll note that the highlighted weeks are the October weeks. It’s amazing that all 5 potential weeks in October are included in either the Best 10 or the Worst 10 weeks of the year. Weeks are ranked based on Avg Trade (last column).
Weeks following the 1st and 3rd Friday in October have been among the worst on average. I’ll also note that the 2 largest “max losing trades” occurred following the 1st and 3rd Friday in October. They were a 12% and an 18% drop.
Weeks following the 2nd, 4th, and 5th Fridays in October made up 3 of the best 10 weeks of the year on average. And they show three of the largest winners as well, with 7.2%, 7.3% and 10.5% max gains.
As I said, October can be volatile. There could easily be some strong moves up and down throughout the month, and traders may want to keep this in mind for position sizing, or if they are making volatility trades.
Want research like this delivered directly to your inbox on a timely basis? Sign up for the Quantifiable Edges Email List.
How about a free trial to the Quantifiable Edges Gold subscription?
