Last year in the 12/30/10 blog I showed that while the last day of the year used to be a bullish day for the market it seems to have changed over the last decade into a seasonally bearish day. I looked at performance across a number of indices last night and found the tendencies to be fairly consistent. Below is an updated equity curve for the NASDAQ Composite on the last day of the year. Its results easily stood out the most.
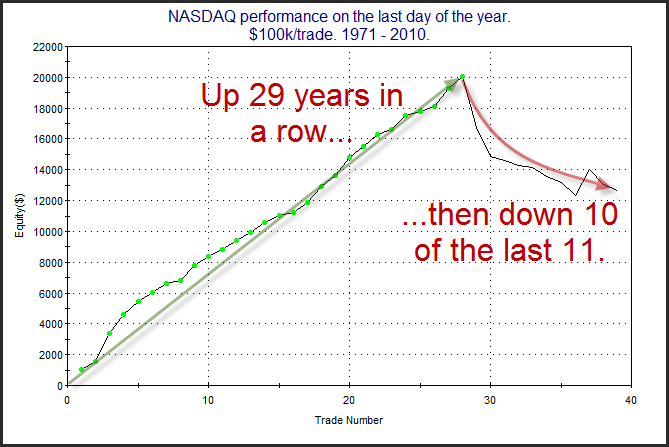
Closing up 29 years in a row is fairly astounding. Just as astounding is the abrupt end to the apparent edge. I am not yet ready to fully label the last day as bearish, but it should certainly no longer be considered bullish. I have no good explanation for why this may have changed, but it obviously has.
And that is something we always need to keep in mind. The market is constantly changing. It is important to always keep studying it, keep an open mind, and adapt as it evolves. Best to all in 2012! I hope it is a prosperous year for you and I hope Quantifiable Edges proves helpful along the way!