One particularly notable indicator change that occurred at the close on Friday is that out NASDAQ/SPX Relative Leadership indicator flipped so that it is now showing the SPX as leading and the NASDAQ as lagging. This can be seen in the chart below.
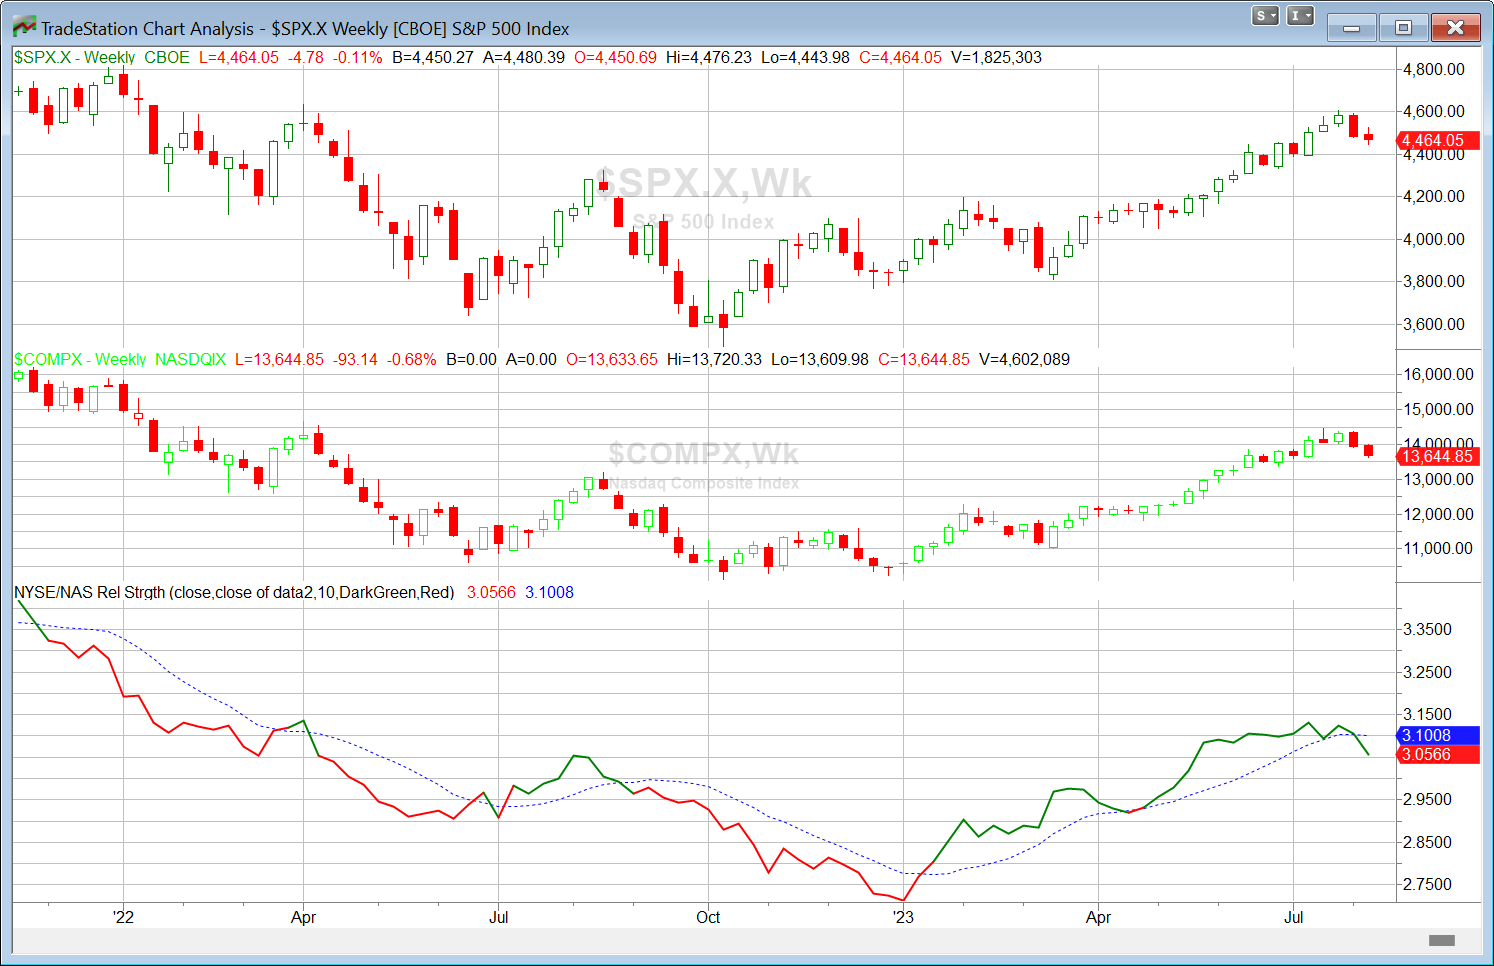
Whenever the solid (green/red) line is above the blue dashed line that means the NASDAQ is leading. When it drops below (and turns red as it is about to do), that means the NASDAQ is lagging the SPX. The market has performed substantially better over the years when the NASDAQ has been leading. You can see in the chart above that the NASDAQ has been the leader for most of 2023. SPX was the leader for most of 2022 as the market struggled overall.
I wrote about this indicator on the blog way back in 2009. I also discussed it in an article for ProActive Advisor magazine last year. Most significantly, it is one of the indicators included in the Quantifiable Edges Market Timing Course. In the course I show how it can be combined with some other indicators to create some simple but compelling market models.
This could be a brief headfake like we saw in April. But it is certainly notable that NASDAQ is no longer the stronger of the two indices. And that is generally an unfavorable condition for as long as it persists.
You may find more information on the Quantifiable Edges Market Timing Course here.