The recent rally has left the market short-term overbought by most measures. Short-term overbought often triggers some studies that suggest a downside edge, but when the overbought condition gets very strongly overbought, then those downside edges often disappear. And at some point, rather than strength leading to weakness, the strength will beget more strength. The strong move higher over the last several days has turned the market so overbought that we are seeing this scenario begin to unfold. The study below looks at the 7-day win streak in the Dow Jones Industrial average. It exemplifies this concept.
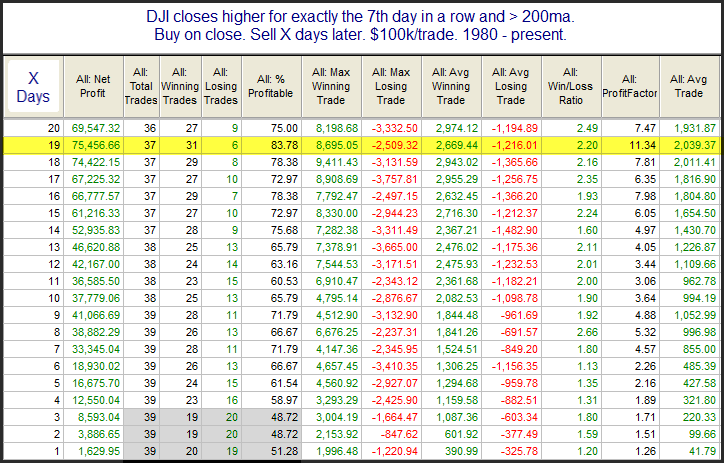
There is not much of an edge over the 1st few days. But once you get out a little further, the stats appear solidly bullish. Below is a look at the profit curve assuming a 19-day holding period.
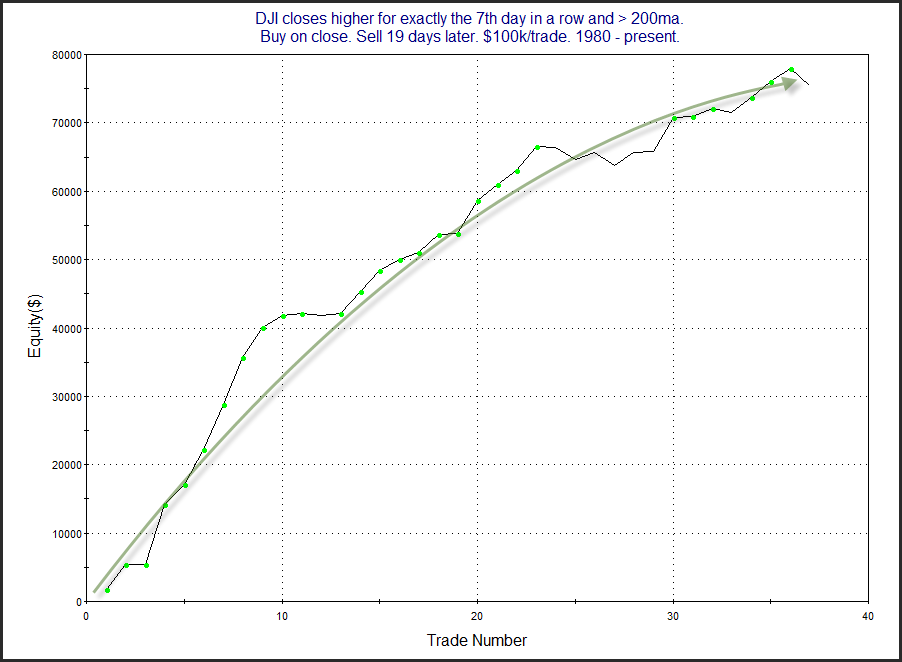
The strong move from lower left to upper right appears to offer some confirmation of the bullish tendency. In last night’s subscriber letter, I also looked at the same setup with SPX, since SPX has also posted 7 higher closes. Results were very similar. Short-term momentum has been so strong recently that it appears likely to carry through some on an intermediate-term basis.
Want research like this delivered directly to your inbox on a timely basis? Sign up for the Quantifiable Edges Email List.
How about a free trial to the Quantifiable Edges Gold subscription?