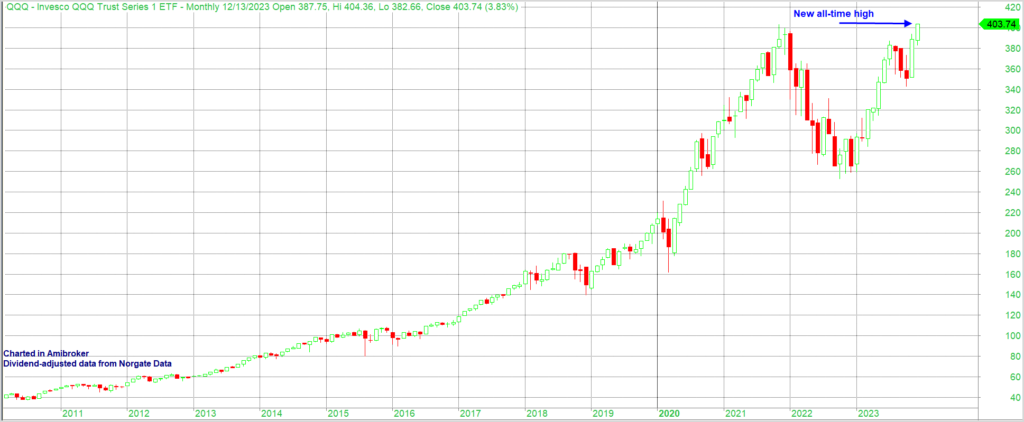
QQQ, on a dividend-adjust basis, is now up over 52% on the year and just made new highs. This can be seen in the monthly chart below.
Meanwhile, TQQQ, which is the 3x version of QQQ, is up over 185% ytd (through 12/13/23). That’s a huge run, and on the surface it would seem to be an enticing long-term holding. But here is the TQQQ chart.
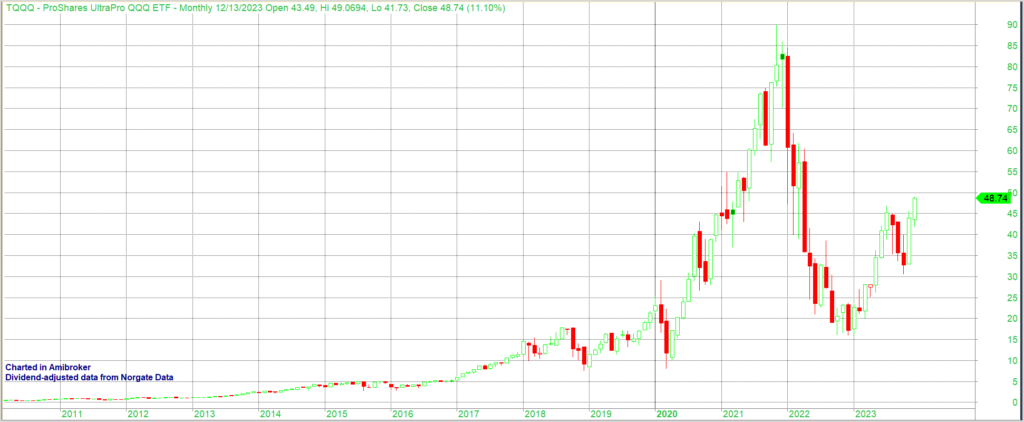
As you can see, TQQQ is still nearly 46% below its all-time (dividend-adjusted) high of $90.08. To get back to a new high, it is going to need to make another 85%. That is some severe underperformance vs QQQ over the last 2 years.
So what gives? It is mostly just a math issue. Leveraged ETFs like TQQQ utilize leverage on a daily basis. TQQQ is a 3x leveraged ETF. So a 2.5% up day for QQQ would be about a 7.5% up day for TQQQ. And a 2.5% down day for QQQ would be about a 7.5% down day for TQQQ. When the market gets volatile and choppy the swings back and forth will hurt TQQQ more than QQQ.
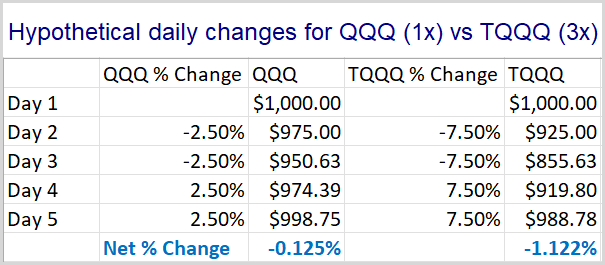
Let’s look at a simple example. QQQ goes down 2.5% for 2 days in a row, and then bounces back 2.5% for 2 days in a row. These are fairly large 1-day moves, but it demonstrates the point nicely. Below is a table showing daily changes for each and the value of the holding over the period.
Keep in mind that smaller drawdowns are easier to overcome than large ones. A 10% drawdown would bring an account from $1000 to $900. To get back from $900 to $1000, you would need to make $100 from the account that is now only worth $900. This would require an 11.1% gain on the $900. As the drawdowns get larger, you end up needing much larger % gains just to recover to the original $1000. A 50% drawdown would take a $1000 account down to $500. To get back to $1000, that account would now need to make 100%! A 90% drawdown would turn a $1000 account into a $100 account. To get back to $1000, you’d need to make 900%!!
So in the table above we see that QQQ has a drawdown that is substantially less extreme than TQQQ. Therefore, it requires much less work to get back near breakeven. At the end of the 4-day move, QQQ is down just 0.125%. But TQQQ is down nearly 1% more than that, with a 1.122% decline. And these are not huge moves, and it is not a long period of time. Larger moves and longer time periods really exacerbate the situation.
Now you may be thinking, “Yeah, but you put the two worst days first. That makes it even harder to recover. So the difference is exaggerated.” No – it isn’t. In fact, it does not matter at all what order I put the days in. The results will be the same. The spreadsheet below shows the same daily returns, except in this case, they alternate down-up-down-up.
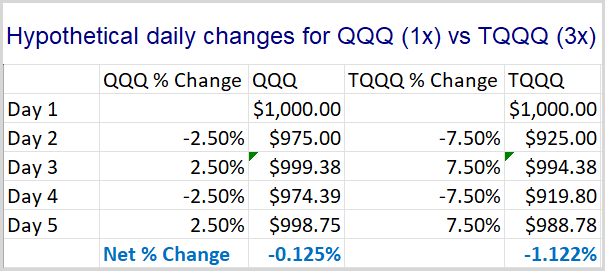
The end result is exactly the same. You can run it in different orders yourself if you don’t believe me. The end result will remain the same. And the bigger the daily moves, the more negative the impact.
So when QQQ suffered a 37% drawdown from it November 2021 high, TQQQ was hit with a drawdown of over 82%. To get back to even from there, TQQQ would need to make back over 450%! And as we saw in the chart above, it is not even close.
You might not yet be convinced of the danger of TQQQ. After all, that long-term chart is still showing massive gains over the last 13 years or so. In fact, TQQQ opened on 2/11/2010 with a dividend and split adjusted price of $0.423931. It currently has return of 11,397% since inception. That blows away the 951% return of QQQ over the same period.
But perhaps TQQQ’s inception date was just exceptionally good timing. What would happen if TQQQ started on the same day as QQQ?
To answer this I created a TQQQ substitute security (TQQQx) with data going back to QQQ inception (3/10/99). I did 3x returns each day. Below is a hypothetical price chart for TQQQx:
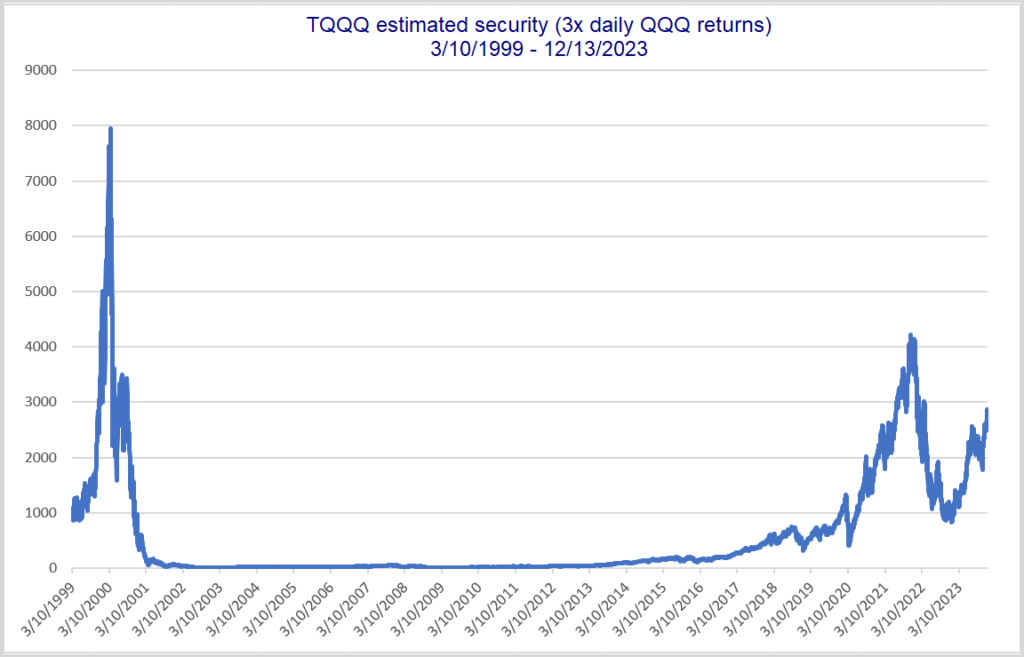
Current price of $2862 means it is still in a 64% drawdown. This estimated TQQQ would need to see a rally of 178% to get back to its high from 2000. Here is a log scale version.
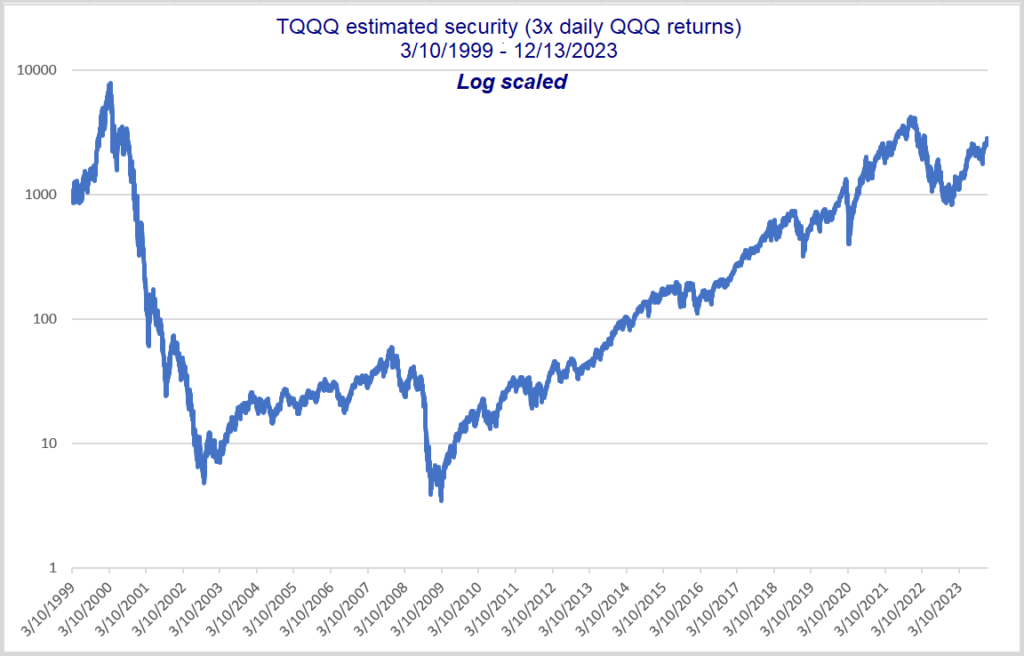
You can see here more easily that the price went from a high of $7961 to a low of $3.47, which is a 99.96% decline. Anyone holding would basically have been completely wiped out – especially if they needed to make withdrawals.
Lastly, I will note that my calculation is overly generous because there are no management fees. If I plug in the split-adjusted TQQQ price of $0.423931 as the 2/11/2010 price in my spreadsheet, it shows a current value of $81.40, instead of the actual TQQQ price of $48.74. In other words, my numbers are too optimistic, and the reality would have been even worse than I show.
Over time I have encountered multiple people that made a fortune over the last 10-13 years by simply holding onto a sizable TQQQ position. But as we see above, leverage can make fortunes, and it can also destroy them. The 2000-2009 decade provides a great example of destruction. Leveraged ETFs should be used with great caution. There’s no telling what the next 10 years will look like. But there is a strong chance it won’t be as friendly as the last. If you utilize leveraged ETFs, an exit plan needs to exist. You don’t want to ride out an 82% drawdown at any age…and you especially don’t want a 99.6% drawdown! Buy(and hold)er beware.
Want research like this delivered directly to your inbox on a timely basis? Sign up for the Quantifiable Edges Email List.
How about a free trial to the Quantifiable Edges Gold subscription?