I have begun sharing one of the Quantifiable Edges Seasonality Calendars each month. This month I decided to show the S&P Midcap 400.
The Quantifiable Edges Seasonality Calendar uses multiple systems to measure historical performance on similar days to those on the upcoming calendar. The systems look at filters like time of week, month, year and so forth. Over the long run, staying out of the market on days that do not appear in green, would have been beneficial. To appear in green the date needs to show a historical Win% of 50% or more and a profit factor of 1.0 or more.
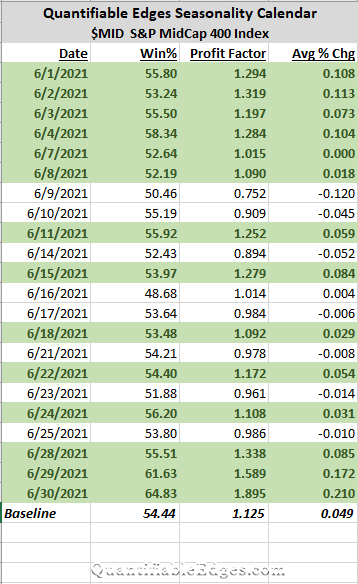
We see some solid seasonal numbers to start off the month. Then it is a mixed bunch for a few weeks. The strongest numbers in June appear in the last 2-3 days. Of course there will be many other factors impacting market action. But historically, avoiding days that do not appear in green has proven beneficial across all the markets we track. This is discussed in the “50/1 Calendar Research Paper”, which is available on the Seasonality page in the client section of Quantifiable Edges. It is available to all subscribers, including those on a free trial.
Want research like this delivered directly to your inbox on a timely basis? Sign up for the Quantifiable Edges Email List.
How about a free trial to the Quantifiable Edges Gold subscription?