As I have shown many times in the past, there isn’t a more reliable time of the year to have a selloff than this upcoming week. I have often referred to is as “The Weakest Week”. Since 1960 the week following the 3rd Friday in September has produced the most bearish results of any week. Below is a graphic to show how this upcoming week has played out over time.
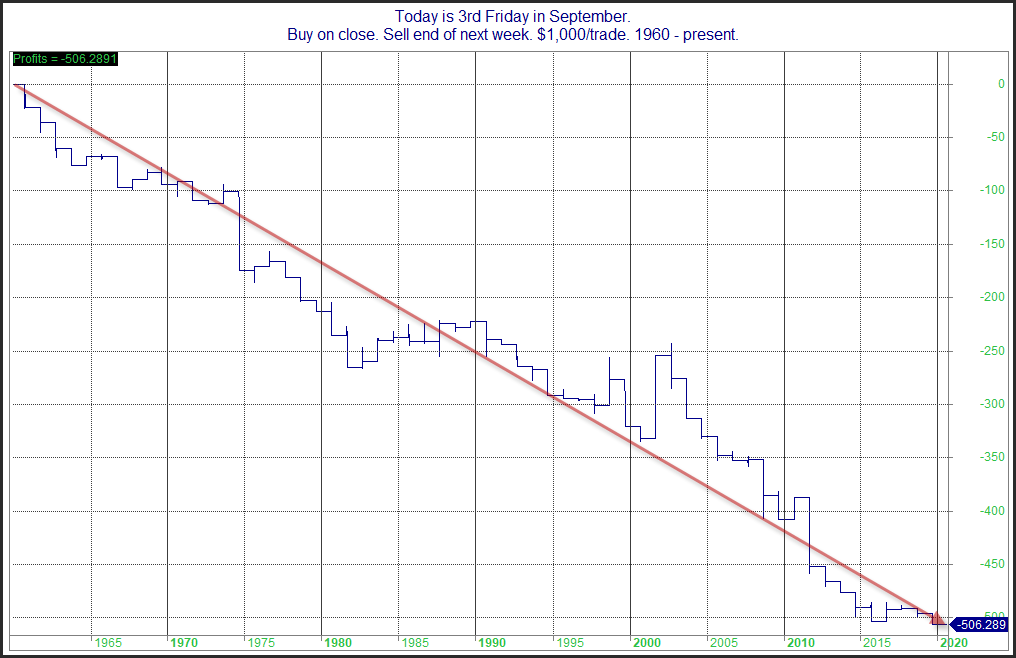
As you can see the bearish tendency has been pretty consistent over the last 60 years. There was a stretch in the late 80’s where there was a series of mild up years. Since 1990 it has been pretty much all downhill. Below is a table showing results of buying Sept. op-ex Friday and then selling X days later from 1990 – 2019.
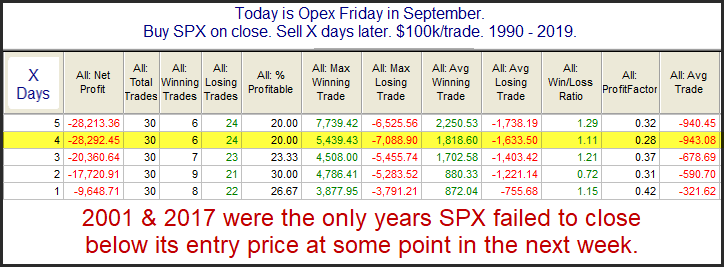
The consistency and net results appear quite strong. I note the only instances that didn’t post a lower close at some point during the following week was in 2001 and 2017. The 9/11 attacks certainly made for unusual circumstances in 2001, and 2017 did not see a decline, but it only rose 2 points, so it was not much of a victory for the bulls.
But this year seems a little different, because this is the 1st time since I have been running these tests that we are headed into the “weakest week” having already closed down 2 weeks in a row. (It has actually been three weeks.) That had me wondering whether the seasonal weakness may have come a little early this year. So I ran a test to look at other instances since 1960 that SPX had at least 2 losing weeks in a row leading up to the post-3rd Friday setup.
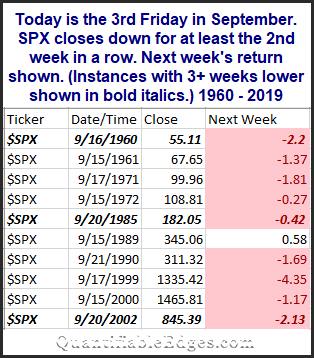
This certainly does NOT suggest the seasonal weakness came early. Nine of ten instances where there were 2 down weeks leading up to the “weakest week”, will still saw the “weakest week” close lower. And all 3 instances where there were 3+ down weeks still had at least one more down week to go. So I am viewing poor seasonality as a bearish short-term factor this upcoming week.
Want research like this delivered directly to your inbox on a timely basis? Sign up for the Quantifiable Edges Email List.