As of this writing the Quantifiable Edges blog has published over 185 posts related to market seasonality. Seasonality can be looked at many different ways. You can factor in things like the day of the week/month/quarter/year. Or the week of the month/quarter/year. Or special days, like market holidays or Fed Days. Seasonality can take many forms, and since 2008 I have published a lot of edges related to seasonality.
In the Quantifiable Edges Market Timing Course I looked at longer-term seasonal influences. I featured the Best/Worst 6 Months of the year, and the Presidential Cycle as longer-term seasonal factors.
Over the years I have also privately tested a number of systems that utilized seasonality. And now I have decided to share the Quantifiable Edges Seasonality Calendars. The seasonality calendars utilize multiple inputs that I have found to be helpful over the years. The statistics they produce are based on rolling lookbacks of similar seasonal setups.
Seasonality Calendars are now available as separate subscription at Quantifiable Edges, but we have also included them with all Gold and Silver subscriptions, at no additional cost. (We may increase the price on Gold and Silver subscriptions in the coming months, but all subscribers will be locked in at their original pricing at that time.)
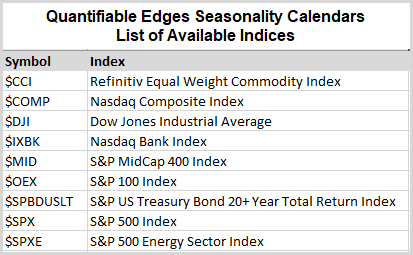
The current list of indices with available Seasonality Calendars can be found below:
The video below provides a short intro to the Calendars, along with the research and resources that come with them: