Quantifiable Edges recently released its Seasonality Calendars. The Seasonality Calendars utilize multiple inputs that I have found to be helpful over the years. The statistics they produce are based on rolling lookbacks of similar seasonal setups. In a special report I updated over the weekend, I showed how some simple filtering based on the calendars would have worked out over the long-term. The report is free to download for anyone with a Quantifiable Edges login (which you can get with a free trial or a free downloads subscription). In the report, I show results for all 9 of the indices we track with the Seasonality Calendars. Here on the blog I will just show the results for SPX.
The filters used look at the upcoming calendar day and go long or flat based on the stats shown for that day. The approach simply looks to see if there is a better than breakeven chance of seeing gains tomorrow based on 1) Win %, and 2) Profit Factor. So a Win % of at least 50% and a Profit Factor of at least 1 for tomorrow would mean we will be long at the close today. If those requirements are not met, we will exit at the close today. So if today is 12/7/2020, the system will look at the calendar for 12/8/2020 and see that the Win % is above 50 and the Profit Factor is above 1, and it will enter (or continue to hold) a long position. If the calendar on 12/9/2020 shows a sub-par profit factor, then we will exit the long position at the close on 12/8/2020.
When in “cash”, the model will earn interest at a rate equal to the overnight Fed Funds rate. I use this rate because 1) it is often slightly lower than the 3-month T-bill, which many people use, and 2) it has the longest history I could find for a short-term rate (1957). So it is conservative, and has a long history. Below are results for $SPX.
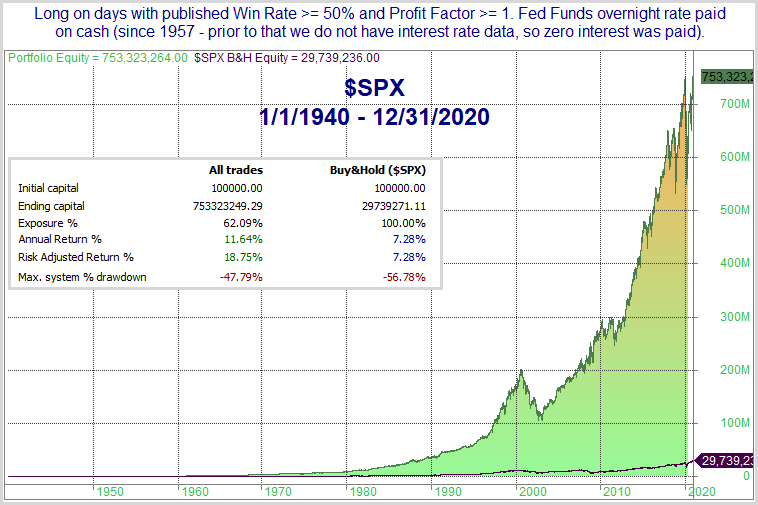
- $SPX (along with $DJI) has the longest available history for our analysis.
- Only being in the market 62% of the time, it was still able to outperform “buy and hold” by a whopping 4.36% per year.
- The strong outperformance was achieved even though there was no interest on cash in the 1st 17 years of the test.
Next, let’s look at a detailed historical drawdown chart.
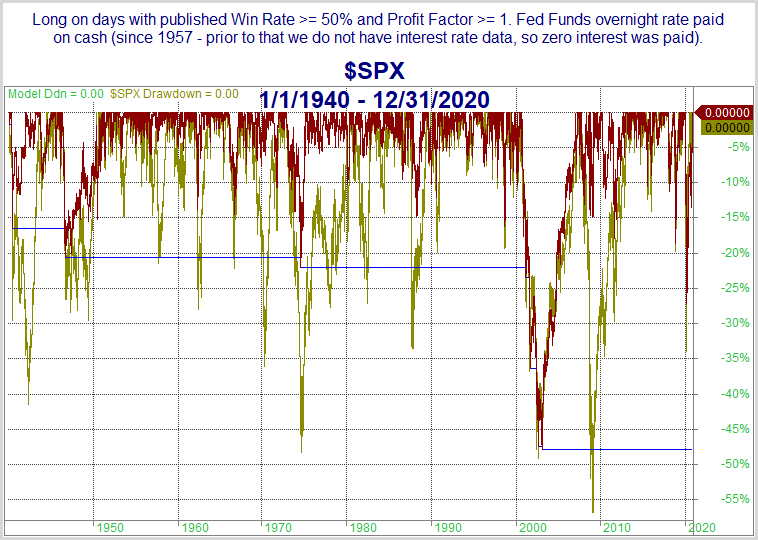
- Drawdown was reduced over “buy and hold”, but was still steep in the 2000-2002 bear market. Part of the reason for this is that the 90s had such a strong bull market that “Baseline” averages were very strong coming into 2000. In other words, reaching 50/1 was easy at the time, so there weren’t many days that got sidestepped early in that particular bear market.
- Most other drawdowns saw significant reductions with the seasonality filter vs “Buy & Hold”.
This past week I released some tools for subscribers that allow them to further test the seasonality calendars on their own. This can be done with either Excel or Tradestation, and I also expect to have an Amibroker version available soon. With these tools, subscribers can conduct their own backtests, change parameters, and begin exploring some of their own ideas as well.
The seasonality calendars and associated tools and functionality are included with any Gold, Silver, or Seasonality subscription.