
Stock market performance leading up to and around many holidays has often been bullish. This is something I have written about several times over the years. Holy Thursday is one such day that has done quite well. I have shown Holy Thursday stats a few times in the past. The chart and statistics below are all updated through last year.
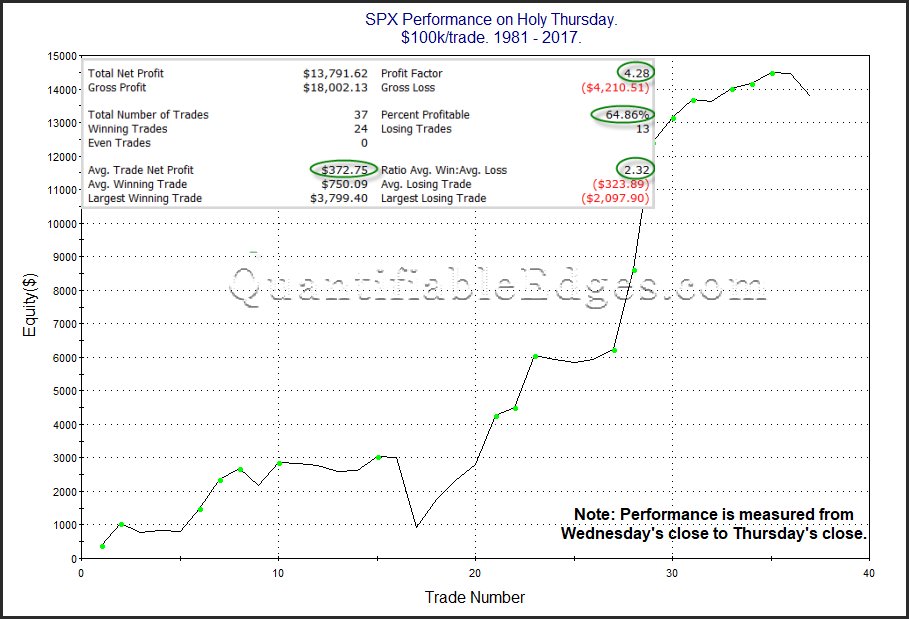
Despite the last 2 years losing some ground, the stats remain impressive, and so does the overall curve. Perhaps the most impressive stat to me is that the up days have been 2.3x the size of the down days. This suggests people will often go into the long Easter weekend with enthusiasm. It will be interesting to see if Holy Thursday bullishness starts to reassert itself in 2018.
You can see many more seasonal studies like this by clicking on the “Seasonality” category on the blog. Another great source of seasonal ideas is @JayKaeppel‘s book, “Seasonal Stock Market Trends”.
Want research like this delivered directly to your inbox on a timely basis? Sign up for the Quantifiable Edges Email List.
