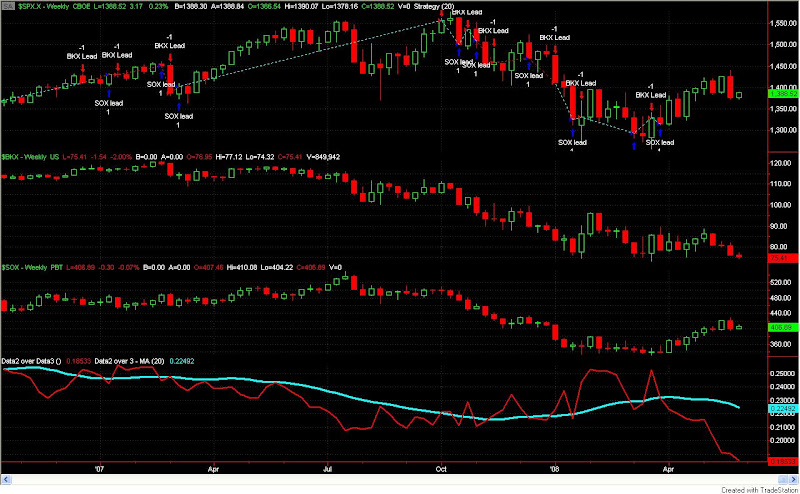
The current ratio of the BKX to the SOX is about 0.18. On January 1st 1995 it was also about 0.18. It has traveled quite a bit to get nowhere. In early July of ’98 the ratio hit a high of close to 0.36 and in March of ’00 it hit a low of about 0.05.
In the chart below I show the S&P 500, the BKX and the SOX. At the bottom of the chart is an intermediate-term relative strength measure. It looks at the current ratio as opposed to the 20-week moving average. When the red line is above the blue, that means the BKX is outperforming the SOX. When the red line is below the blue, that means the SOX is outperforming the BKX.
What if we compare the BKX to the S&P 500? This may provide a better picture of leader/laggard without worrying about the SOX. The BKX/SPX ratio is about 0.054 now. In January 1995 it was 0.056. In this case the S&P has gained about 979 points when the BKX was a laggard, and lost 55 points when the BKX was a leader. Not quite as severe, but the point remains the same – historically the BKX has not been a leader of strong rallies. The market may have trouble rallying strongly without faith in the banks, but that doesn’t mean these classic laggards will all of a sudden become powerful leaders.

