The Quantifiable Edges Capitulative Breadth Indicator (CBI) is a tool I have spoken about quite a bit lately, since we have seen a few recent spikes in the CBI. In the Quantifiable Edges CBI Research Paper I published last month (download information here) I examined the CBI a multitude of ways. Below is an excerpt from a section of the paper where I looked at 50-day lows and different CBI levels.
By combining CBI readings with a market that is hitting new lows, the results are often even more interesting. Let’s consider some studies that examine how the market has performed after hitting new lows, and break down those returns by CBI readings. The first one looks at performance following 50-day low closes when the CBI is 0.
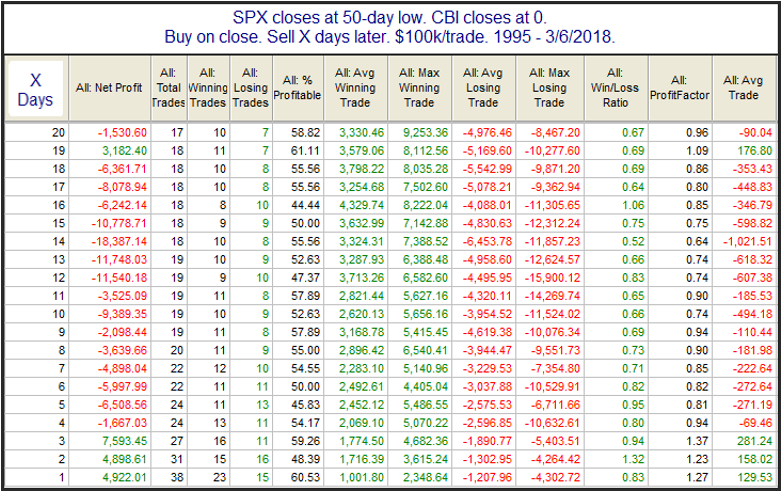
Other than perhaps a very quick bounce this has not been a favorable setup for the bulls. From 1-4 weeks out the results have nearly all been net negative…Lastly, let’s look at high CBI readings of 10 or above. {Note: I removed a couple of studies here on the blog for brevity. The full suite can be seen in the report.}
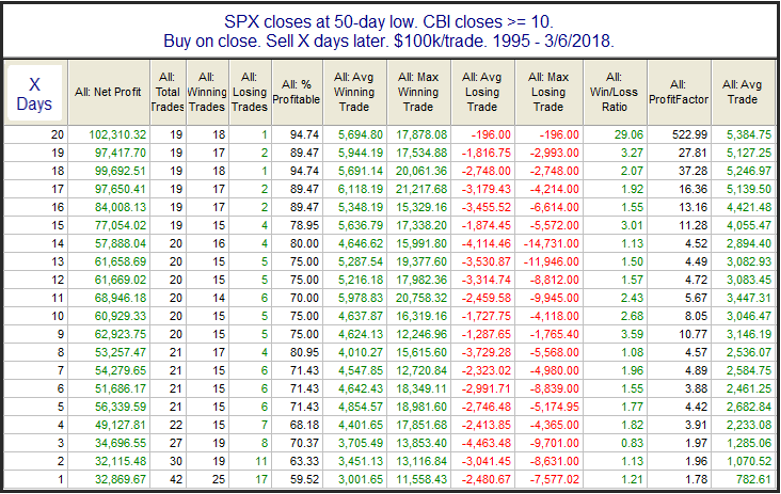
These are by far the most appealing results, from Day 1 right through day 20. And 20 days out there was just one loser and it only lost 0.2%. Meanwhile, the average gain of the other 18 instances was a sizable 5.7%.
Unfortunately for bulls, today is highly likely to finish with a CBI of 0. So no strong edge is suggested if we do finish at a 50-day low. I do see some other indications of a possible bounce, but the CBI certainly is not one of them. I will be sure to alert readers if it does spike in the coming days.
To learn more about the CBI, check out the CBI Research Paper.
Want research like this delivered directly to your inbox on a timely basis? Sign up for the Quantifiable Edges Email List.