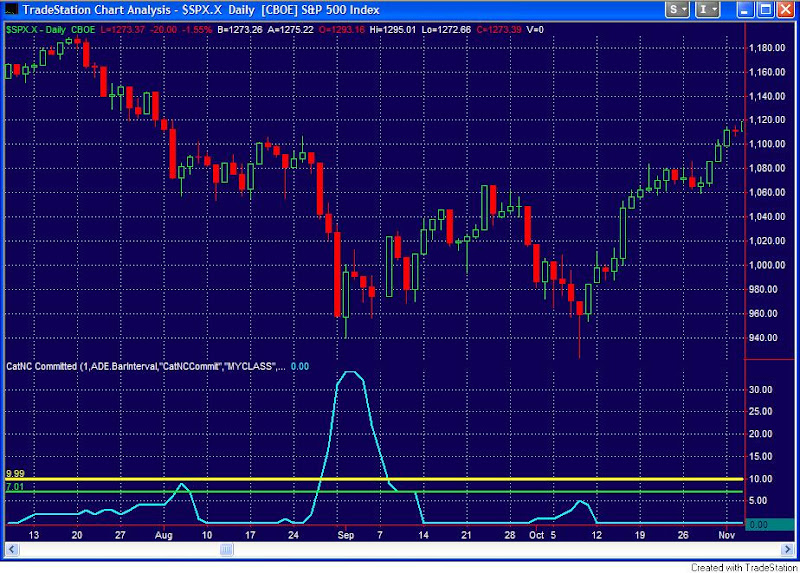
The Capitulative Breadth Indicator (CBI) spiked to 15 today. This is the highest reading it’s posted since I began tracking it live in 2005. Backtests to 1995 show only 3 other instances when the market was closing at new lows and the CBI was as high as 15. They occurred in August of 1998, September of 2001, and July of 2002. All three instances eventually shot up to mid-30’s or higher. The highest CBI reading was July 2002 at 52. Needles to say, we’re hitting some pretty elite levels here and those other selloffs were about as scary as they come.
The 2001 and 2002 charts are posted in my Jan 22nd post “How Bad Can It Get?”. The 1998 chart is below.
I’d suggest traders review their own charts of those periods as well to better formulate a game plan they’ll be comfortable executing. Those selloffs were incredibly scary. There was also incredible opportunity for short-term profit at those bottoms. The market is going to bounce. I believe it is going to bounce very sharply. It may sell off a significant amount price-wise before that bounce occurs. Time-wise I still believe we’re only days away from a multi-week bottom. I’m currently on the lookout for a washout day or a reversal day that could mark the low.

