I haven’t mentioned the Capitualtive Breadth Indicator (CBI) for a while. For those unfamiliar it is a proprietary method of measuring the amount of capitulation evident in the market. You may read the intro post here or the entire series here. Since the November lows it has been pretty much dormant except for a quick blip in January. It began to move up last week and at Friday’s close it hit 7. Long-time readers will recall that this is a level where I feel a decent bullish edge exists. Below is a chart of the CBI from the Quantifiable Edges members section.
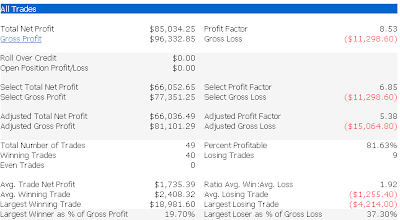
In the past I’ve demonstrated that it can be used as a market timing tool for swing trades. One “system” I’ve shown here on the blog is to purchase the S&P 500 when the CBI hits a certain level (7 being one of them) and then sell the S&P when it returns back to 3 or below.
Below is an updated performance report of the above “system” covering 1995-present.
I’ll keep readers informed of significant changes in the CBI over the next several days until it returns to neutral.


