When The Market Does What The Market Doesn’t Do

Some times when conducting historical analysis a small sample set can tell you that the market is doing something extraordinary. Indicators reaching excessive readings often suggest an edge because when things get too extreme, mean reversion tendencies tend to kick in.

There are other instances where a small sample set simply suggests the market is not acting as it should. Monday’s action may be a good example of this. Gains of 3% – 4% that occurred on Friday were given up Monday in all indices on an intraday basis and most on an end of day basis. The S&P 500 rallied over 4% on Friday. After dipping below Thursday’s close late in the day Monday, it barely closed above it. I ran a test to find other times since 1975 that the market had gained at least 4% one day and then printed a low below the close of 2 days ago.

Today was the first.

I loosened the requirements to 3.5%. Still nothing.

3%. Nope.

2.5%? Yes – two instances. Even at 2% there have only been 6 instances in the last 33 years where the market has given back all its prior day gains.

Now, in case you interested, all six of these did bounce above the selloff day’s close within 2 days. In fact, 5 of them managed to bounce the next day. The bounces did tend to die out after day 3. So perhaps there’s a small upside edge based on this study, but that’s not the real takeaway.

What’s significant here is that the market is acting in a way that it shouldn’t. It especially shouldn’t if it is planning on launching a great bull move. Look at some of the charts I’ve posted in the blog the last few days. Look at periods like March ‘03, July & October ’02, September ’01, September & October ’98, November ’97 and any other bottom you find. Massive one-day gains coming off lows simply don’t get wiped out the next day. It doesn’t happen. It happened Monday.

I would consider Monday’s action a warning sign.

If nothing else traders should still be operating under the assumption that the market environment remains extremely choppy. Look to take advantage of the chop. As an example, the incredibly simple system I published for shorting a few weeks back has had 4 trades since. Here they are (all trades based on SPX closing prices):

Short 8/27 – cover 9/2 – 0.32% gain
Short 9/8 – cover 9/9 – 3.41% gain
Short 9/11 – cover 9/15 – 4.43% gain
Short 9/19 – cover 9/22 – 3.83% gain

That’s 12% from just the short side in a little over 3 weeks. All based on an incredibly simple system. Playing the chop has been working. Monday’s action suggests that despite last week’s bottom attempt, this hasn’t yet changed.

Is The Lack of a CBI Spike a Bad Omen?

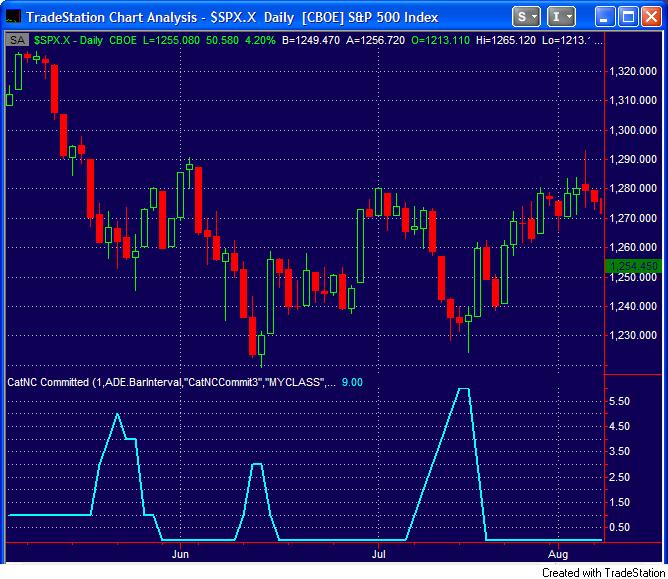
I received an interesting question from a subscriber about the lack of action in the CBI and whether there have been successful bottoms in past that occurred without a spike in the Capitulative Breadth Indictor. With moves to 10 or higher in November, January, March, and July it would seem curious we only reached 5 last week.

While somewhat rare, there have been bottoms that did not see the CBI reading reach 7 or higher at any point in the downmove. The most recent was the May-June selloff in 2006, which peaked at 5 on the May leg down and only reached 3 on the June leg down. This can be seen in the chart below. The CBI is the indicator in the bottom pane. The S&P 500 is charted on top.


The March, 2001 bottom which led to a 2-month rally in the S&P had a CBI reading that peaked at 6. During the sharp selloff in October of 1997 the CBI only reached 4.

The one that might seem most similar to the current situation is October of 1998. After spiking huge in August (similar to July of this year), it hardly budged on the October leg down, peaking at 5.

While I don’t store intraday readings, I did notice on Thursday morning that had the market closed near Thursday’s lows it would have led to a CBI of 8.
In summary, I wouldn’t consider the lack of a high CBI reading a negative for the rally potential. I’ve found it most useful as a short-term indicator and not suggestive of long-term implications.

Big Ass Reversals

The kind of price action we’ve seen in the S&P over the last two days has been found almost exclusively in one type of place – bottoms.

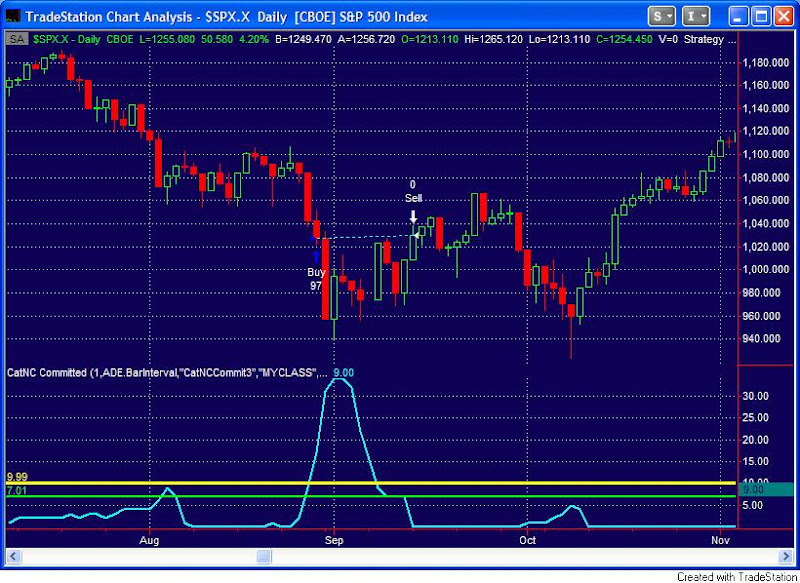
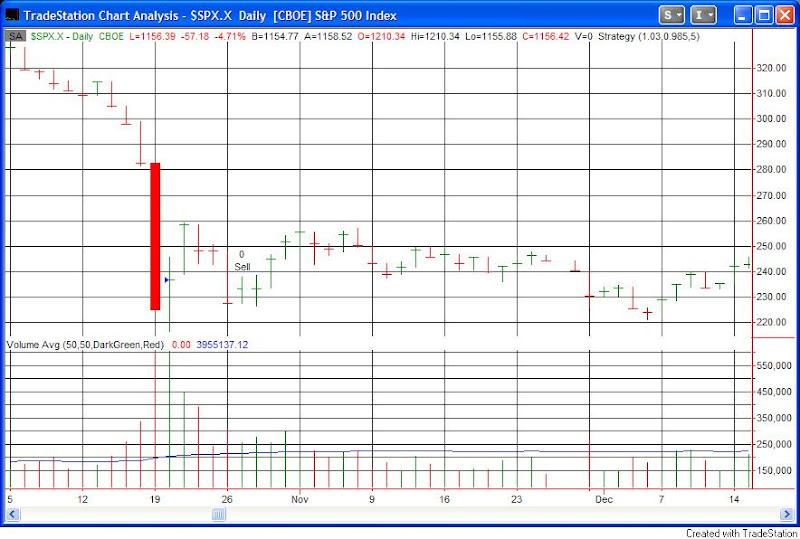
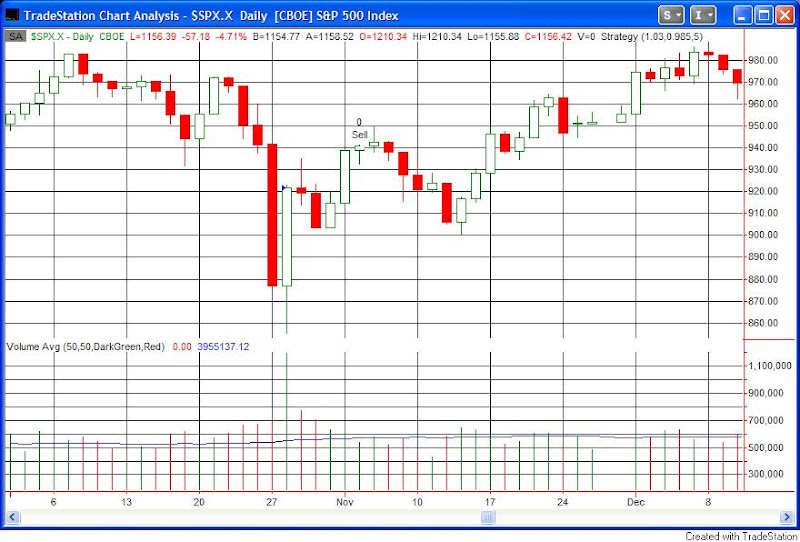
I looked at any time the market closed up by at least 3% today after being down over 1.5% yesterday. Both days had to have at least a 3.5% range. There was no criteria stating the market had to have suffered a significant selloff – but it always did. I don’t have charts of the 1st 3 instances. The rest I do.

The first was 10/24/62 and it led to a major bottom and an immediate rally. The 2nd was 11/26/63 and the story was pretty much the same there. A big rally ensued. The pattern also appear on September 5, 1974. That was the lone disappointment. The market made two more legs down before bottoming out a month later.

The next 6 instances are all shown below. I’d suggest studying them.

1987
1997
1998
2000
2001
2002

Money Market Mess

I keep my IRA account with a broker. On Tuesday night I had 3% of my portfolio allocated to options trades and 97% allocated to cash. Or so I thought.

Wednesday morning my cash suffered a 3% gap. In fact, my cash gets swept each night to the Reserve Primary Fund – a massive money market fund. They broke the buck Tuesday night and managed to fall to $0.97.

Here’s their excuse: “The value of the debt securities issued by Lehman Brothers Holdings, Inc. (face value $785 million) and held by the Primary Fund has been valued at zero effective as of 4:00PM New York time today.”

The full press release is here.

If you don’t want to read the whole thing, here’s the real kicker (for me anyway):

“Effective today and until further notice, the proceeds of redemptions from The Primary Fund will not be transmitted to the redeeming investor for a period of up to seven calendar days after the redemption.”

My broker has now informed me that I will not be able to place any more trades in the account for the time being. They can’t be cleared if I can’t get the cash from the Reserve Fund. Awesome time not to be able to trade.

Tonight Reserve Funds posted a new press release. Two more of their funds broke the buck. The Reserve Yield Plus Fund priced at $0.97 and the Reserve International Liquidity Fund priced at an astonishing $0.91.

Here is a nice little excerpt from the Reserve Yield Plus Fund Annual Report dated March 31, 2008.

The cash entrusted to us is your reserve resource that you expect to be there no matter what. This is why we call ourselves The Reserve. Be you an individual, institution or a Fortune 500 company, this is your working capital to pay the rent, to finance inventory and receivables, to put food on the table. This is definitely not money to take risks with, and that is exactly how it should be managed.

We have been “accused” by some of asserting these tenets as if they were dogma to which The Reserve pleads: Guilty as charged. If one focused on the goal of effective cash management, the truths to accomplish it are self-evident and unequivocal, and reaching for yield while risking principal, liquidity or peace of mind is not among them…

…Thank you for your confidence in our Reserve. We never forget you have entrusted us with your reserve(s).

Bruce Bent
Chairman and CEO

Nice work Bruce.

I certainly hope these guys are the only ones dumb enough to invest money market assets in worthless paper, but I tend to doubt it. I would not be surprised to see a mass exodus out of non-treasury money market funds. I’m sure that won’t help those still trying to maintain the buck. There could be more carnage to follow. One result already is that everyone wants treasuries and they’re now at the lowest yield since at least WWII.

For information on opening an account with the Reserve Funds, click here.

An Interesting Pattern Of Strength

After gapping down Tuesday morning the market put in a sizable rally. The S&P gained over 4% from open to close. I looked back at other times the SPY gapped lower and then gained over 3.5% from open to close.

The low number of instances means this is more “interesting” than “significant”. The pattern was fairly consistent as 5 of the 6 closed below the entry point within the next week before launching higher. The six instances occurred on 10/28/97, 10/15/98, 1/3/01, 7/24/02, 3/17/03, and 1/23/08. Some significant bottoms in that mix. The only instance that didn’t pull back within the next week was 10/15/98.

Some Older Studies That Should Be Reviewed

It’s official. July was NOT the bottom. Today marked a new low (in a number of ways) for the S&P 500. One measurement that isn’t as extreme as at the July bottom is the number of new 52-week lows today on the NYSE. Some may see this as a positive divergence. I did a study a few months ago and found the divergence to be unreliable.

Since that study there have been 2 new such divergences where the S&P made a new low but the number of new lows contracted. The 1st was 3/17/08 which led to a decent rally that ultimately failed. The 2nd was 7/7/08. The market sold off for another week before starting a rally that would quickly peter out and has now failed.

In preparing for Tuesday, traders may be well served to review some of my Fed Studies – in particular “When the S&P is Oversold Going Into a Fed Day” and “How The Market Might React To The Fed”. This last one was written in anticipation of the Fed meeting on the Tuesday following the Bear Stearns debacle…sound familiar?

Why It’s Dangerous To Jump To Conclusions With A Small Sample Set

Below are a couple of tests I showed in Thursday night’s Subscriber Letter. They provide a nice example of why it’s dangerous to quickly jump to conclusions without solid evidence and a decent sized sample set.

When the market makes a large gap lower and then reverses strongly that is normally considered bullish. In fact, the evidence is unclear. Testing on the SPY using Thursday’s action would agree with the bullish assumption:

The number of trades is very low but the stats are suggestive of bullish implications after a short pullback. Eight of nine instances closed lower at some point in the next 3 days by an average of ¾%. Looking out 10 days every instance had at least 1 close higher. So pretty good stats, but not entirely convincing. I tested on the NDX as well. Here we see a large discrepancy with the SPY results.

Results here suggest quite bearish implications. The take away is that the setup does not clearly suggest an edge either way. Someone accepting the low number of instances and only checking either the SPY or the NDX might be led to believe otherwise.

Rebound Breadth Is Weak

The first day of a bounce can sometimes be a good indication of whether that bounce is likely to succeed or roll over. I recently showed an example of how a weak bounce (price-wise) can suggest a downside edge. That study is in effect again tonight.

Breadth can also be important to watch. After seeing down volume account for about 90% of total NYSE volume during Tuesday’s selloff, today’s bounce higher only rebounded with about 56% up volume. I performed a study which looked at other times the market dropped at least 2% on over 85% down volume on day 1 and then rose on under 60% up volume on day 2.

The setup was fairly rare from 1970-2000, triggering 15 times in 31 years. There was no discernable edge over this period of time, either. From 2001 through today it has triggered 14 times and consistently predicted downside. Below are some statistics on those instances:

12 of 14 instances posted a close lower than the trigger price in the next 2 days. Within 3 days all 14 posted a lower close.

In the last 13 months the frequency of occurrences has picked up tremendously. Wednesday marked the 8th instance since August 2007. The previous 7 instances are listed below with a 6-day exit.

No Overwhelming Edge Apparent

Hard to remember a time when such interesting action has led to such dull results. Tonight I decided to just cut and paste an excerpt from the Subscriber Letter…

Normally, volatile trading like we’ve seen recently leads to some solid trading edges. Not the case so far this week. I’m having a hard time uncovering anything terribly compelling.

When considering indicators, those that measure fear or capitulation are simply not registering the kind of extremes seen around market bottoms. The VIX has moved higher but it hasn’t spiked in a substantial way. The VIX:VXV ratio just poked above 1 for the first time in a while on Tuesday. Ratios of 1.1 or higher have more often been seen near bottoms. New lows have risen but are not even close to the levels seen in July. The CBI is at a paltry 3. The McClellan Oscillator is not near overdone. The percent of stocks trading above their 40-day moving average is over 40%. Near the July bottom it dipped below 10%.

Of course most indices are still North of the July bottom. Therefore, you would expect the breadth, fear, and capitulation indicators to be less extreme than in July. Still, without evidence of a washout in progress, I have little inclination to step in front of this market and start buying.

The price action isn’t providing much in that way of clues either. Much of what I’m seeing is nearly unprecedented. I looked for other times the S&P made 2% in one day and then saw those gains completely wiped out the next. It’s only happened twice before: 3/24/03 and 6/6/08. If I loosen the requirement to a 1.5% rise, then there are 16 occurrences. Unfortunately, trading after these instances was mixed and choppy with little discernable edge. I also looked at performance following drops of 3% or more in the S&P. Again, mixed results.

The NDX action continues to be notable. Today marked the 6th day in a row the Nasdaq 100 has closed below its lower Bollinger Band. Unfortunately, there is little precedent here as well. There have only been 3 occurrences since its inception in 1986. They were 12/18/89, 3/31/94, and 5/18/06. Certainly it’s overdue for a bounce but I’m not terribly excited about buying into it at this point.

Some Additional Sites I Frequent

The market has provided extremely unusual action over the last few days. Precedents are slim when looking at gaps up of 2% or more and other oddities such as yesterday’s S&P/NDX divergence. Trying to filter the action further and generate meaningful statistics is a bit of a stretch.

Therefore, I decided this morning would be a good time to add some sites to the blogroll. Below are a few additions that I like to read:

Marketsci – Filled with interesting market studies.

Woodshedder – A nice mix of mechanical system development and technical analysis.

Carl Futia – Futures trading and analysis with specific targets provided.

Cobra’s Market View – Market analysis with a massive chartbook.

HeadlineCharts – One or more interesting charts along with commentary most every day.

Greenfaucet & Phil’s Favorites – Two sites with a collection of interesting commentary from around the blogosphere.

ITrade4Real – See what JP Drake is trading today.

That’s it for now. I’ll add a few more in the coming weeks.

A Couple More Stats On Massive Gaps

When looking at gaps in the SPY as in my last post, buying a break above the 1st half hour of trading and holding until the end of the day would have resulted in 7 winning trade and 3 losing trades.

Unfortunately losers were much larger than winners as they averaged -2.7%. Winners averaged +1.3%.

5 of the winners occurred when the break happened after 10:30 Eastern.

All of the losers occurred when the break happened between 10 and 10:30 Eastern.

Good luck trading today.

Quick Stats On Massive Gap Opens

It’s Monday morning and the futures are up over 3.0% due to the FNM/FRE bailout news. Since 1998 there have been 16 times when the S&P 500 has gapped up 2.0% or more. Eight of those times it closed higher than the open, and eight it closed lower.

Of the 16 instances 10 saw an intraday drop of 1% or more from the opening price and 6 did not.

12 of the 16 broke below the lows of the 1st half hour of trading at some point during the day. Shorting that break and holding until the end of the day would have resulted in 6 winning trades and 6 losing trades.

5 of them broke the lows of the 1st half hour after 10:30am. Of those, 4 went on to close even lower on the day. The lone instance that rebounded closed almost 3% higher, though.

So far I’ve yet to indentify a sizable edge for trading a gap this large on an intraday basis. I will update further if I do.

Downside Acceleration Frequently Precedes Reflex Rallies

When a move that is already becoming extended rapidly accelerates it frequently means a countermove is about to begin. I discussed this concept in April in the context of an intraday timeframe. Tonight I will finally show its historical effectiveness using daily bars.

After trading lower for three days in a row, the S&P 500 (and most everything else) completely collapsed today, finishing down about 3%. Below is a study that shows the short-term statistics following similar setups:

The edge erodes after the 1st week. It’s basically a short-term setup. To give some perspective on how often any kind of bounce above the entry occurred I ran a 2nd study that looked to exit any time the trade closed profitable.

Pretty impressive reliability. Here we see 81% winners within the next 2 days, 89% within a week and 96% within 8 trading days.

Today’s drop was not only the biggest of the move down, it was over twice the size of the next biggest drop (last Friday). Generally, the more extreme the drop in comparison to the other days, the better the results. Below are the stats associated with a 2x drop similar to today:

Better winning percentage, higher average wins and lower average losses make for better overall stats. I also ran the “1st profitable exit” strategy here:


Thirteen of fourteen were positive within 3 days. By day 8, all fourteen instances were positive.

This all suggests a reflex move higher is likely in the next few days.