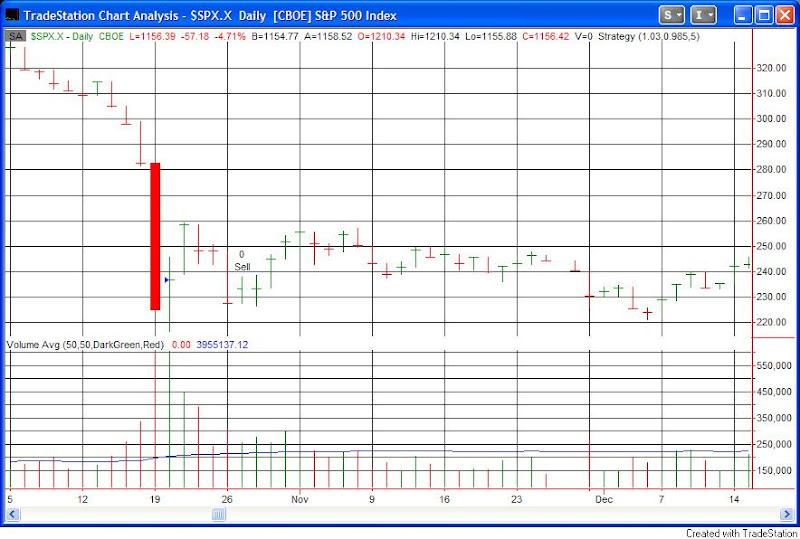
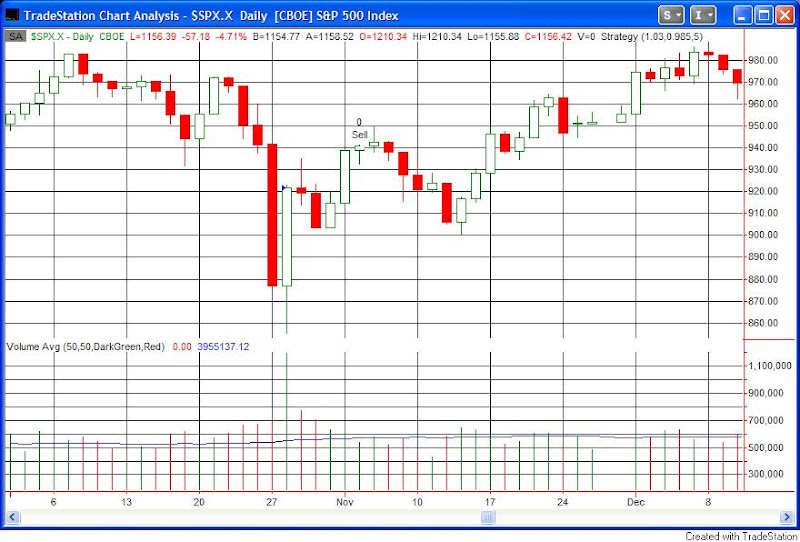
The kind of price action we’ve seen in the S&P over the last two days has been found almost exclusively in one type of place – bottoms.
I looked at any time the market closed up by at least 3% today after being down over 1.5% yesterday. Both days had to have at least a 3.5% range. There was no criteria stating the market had to have suffered a significant selloff – but it always did. I don’t have charts of the 1st 3 instances. The rest I do.
The first was 10/24/62 and it led to a major bottom and an immediate rally. The 2nd was 11/26/63 and the story was pretty much the same there. A big rally ensued. The pattern also appear on September 5, 1974. That was the lone disappointment. The market made two more legs down before bottoming out a month later.
The next 6 instances are all shown below. I’d suggest studying them.


