I discussed the QE Buying Power Index a few times in the last week and demonstrated how it could be used as a filter for a mean reversion system. While a good number of people have signed up for the webinar there are many that remain unconvinced of its value. There are likely also a large number of you who after seeing the mean-reversion results thought, “Who cares? I don’t trade mean reversion techniques.”
So I’ll show one more example before I get the blog back to regular programming. This time let’s look at the QE Buying Power Index and its impact on a simple breakout system over the last 4 years.
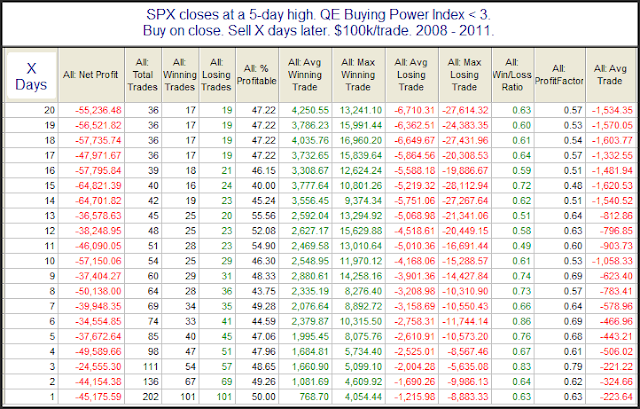
This first study below looks to buy the SPX any time it closes at a 5-day high and hold for X number of days. I also filtered to exclude any instances where the QE Buying Power Index was 3 or greater. (This is the same level used in the mean-reversion posts.)
As you can see it is red across the board. This would have been a losing strategy and not one with an edge.
Now let’s look at results using the same techniques but this time filter to only include those instances with a QE Buying Power Index of 3 or greater.
Huge difference here. The first couple of days are a bit of a crapshoot, but after that statistics turn strongly bullish. This again would suggest that if you are looking to go long the market you want to have Buying Power on your side.
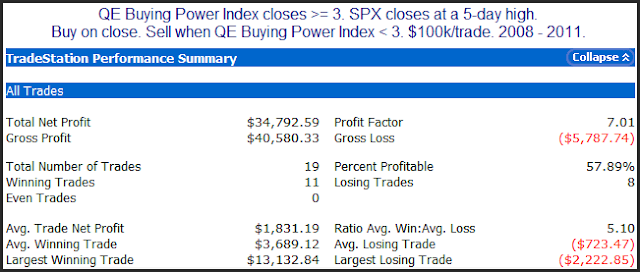
Let’s look at a simple system designed to trade long when 1) buying power is strong, and 2) price confirms by making a new high.
Results here are very strong. Typical of a breakout strategy vs. the mean reversion approach the % profitable isn’t as strong but the winners far outsize the losers and the big wins bring in some hefty profits.
Learn how to compute the QE Buying Power Index in one of our special upcoming webinars. (Or sign up and view the recording if the times don’t work for you.) And you have nothing to lose, because they are 100% satisfaction guaranteed. (Guarantee relates to quality of the information, and is NOT a performance guarantee.)


