The Quantifiable Edges Capitulative Breadth Indicator (CBI) spiked up 14 points on Tuesday – rising from 5 up to 19. In the CBI Research Paper I showed that a CBI total of 10 or more has generally been a bullish sign. So 14 is a very strong 1-day change. In June I examined all other instances where the CBI spiked by at least 10 points in 1 day. I have updated that research below.
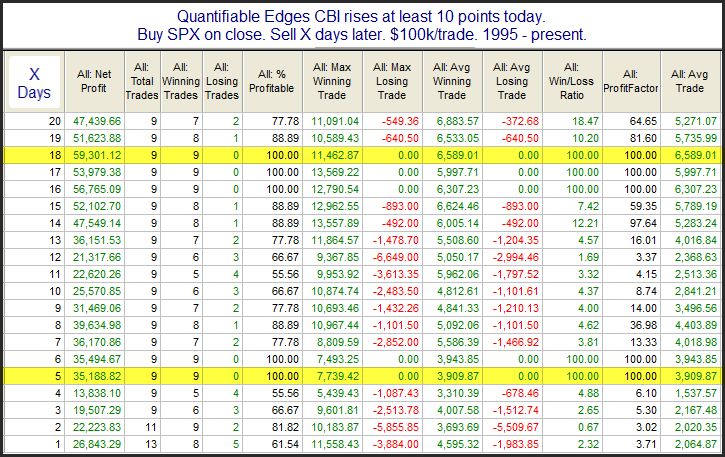
The setup is rare, but there are some very strong numbers here. Over the next week the average instance gained 3.9%, and the average 18-day % gain was 6.6%. Below is a look at all the individual instances.
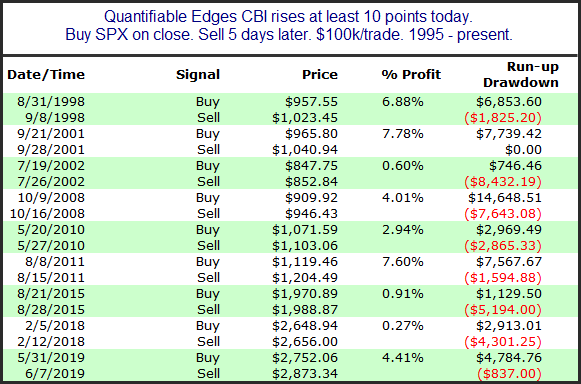
Here we see that the bounces have typically been strong, but they have not always been immediate. 2002, 2008, and 2015 all show some additional scary selling before the big reversal arrived. The CBI is suggesting a strong chance of a sizable bounce over the next week or more. It may or may not begin on Wednesday.
Want research like this delivered directly to your inbox on a timely basis? Sign up for the Quantifiable Edges Email List.