Friday was the 4th day in a row that the NASDAQ closed higher. While this may not seem to be a big deal, it does not happen very often when the NASDAQ is trading below its 200-day moving average. The table below shows results following all times this has occurred since 2002.
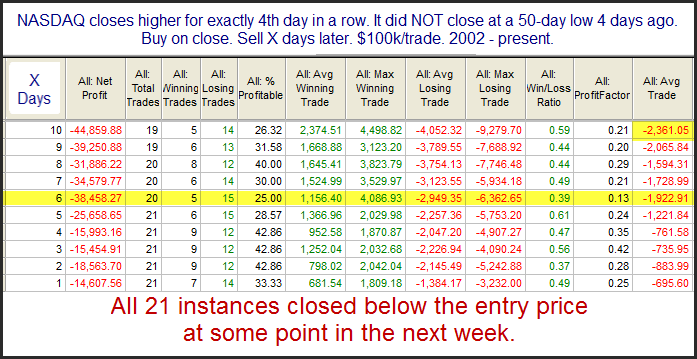
Results here appears to be strongly bearish. And the edge persists for up to 2 weeks. The note at the bottom is worth considering, in that all 21 instances saw some kind of pullback in the next week. Traders may want to keep this in mind over the next few days.
Want research like this delivered directly to your inbox on a timely basis? Sign up for the Quantifiable Edges Email List.