The VIX posted its lowest close since the 2020 COVID Crash on Thursday. October is known for its volatility, so as you might expect, posting a low in implied volatility during October is somewhat unusual. Looking back to 1990, this is just the 6th time that has occurred. I’ve listed all of them below, along with forward SPX results. (Note, only the 1st instance is listed. Some years there were multiple instances, but I did not include repeats.)
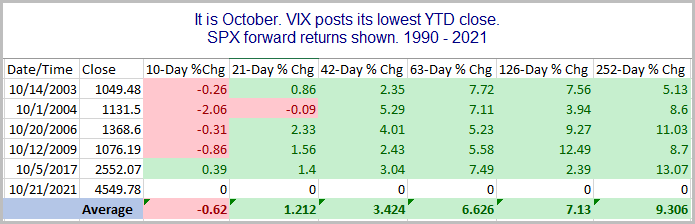
Five instances is too few to draw solid conclusions. But I did find the results interesting. I noted that 4 of them occurred during the “lost decade” of 2000 – 2009, when stocks showed no gains over 10 years. Still, all of those instances were followed by gains between 2-12 months out. And so was the 2017 instance.
Want research like this delivered directly to your inbox on a timely basis? Sign up for the Quantifiable Edges Email List.
How about a free trial to the Quantifiable Edges Gold subscription?