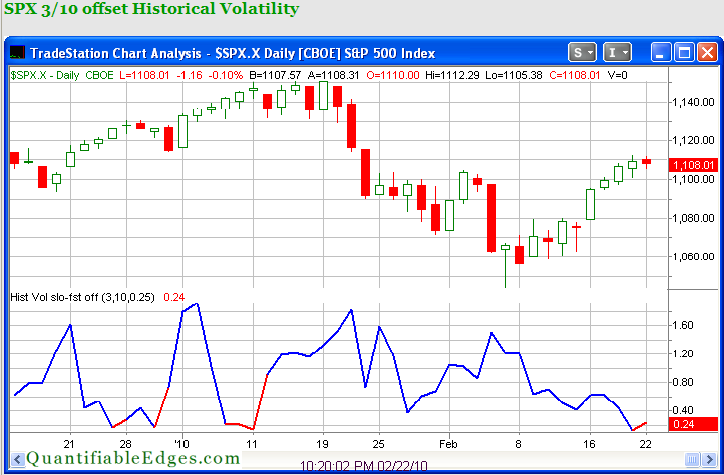
Over the last few days there has been a sharp contraction in volatility. In July I discussed an indicator that looks at the 3-day historical volatility and compares it to the historical volatility of the previous 10 days. When the ratio gets very low (below 0.25 in the study) it suggests a rapid expansion in volatility is likely.
I show this indicator each night on the charts page of the members area. I’ve pasted a copy of the chart below.

