Employment days have an interesting history and they have contributed to some worthwhile studies over the years. Below is a chart of SPY performance on Employment Days. For this equity curve I filtered to only include days where SPY was > its 200ma. Each trade was a fictional $100k.
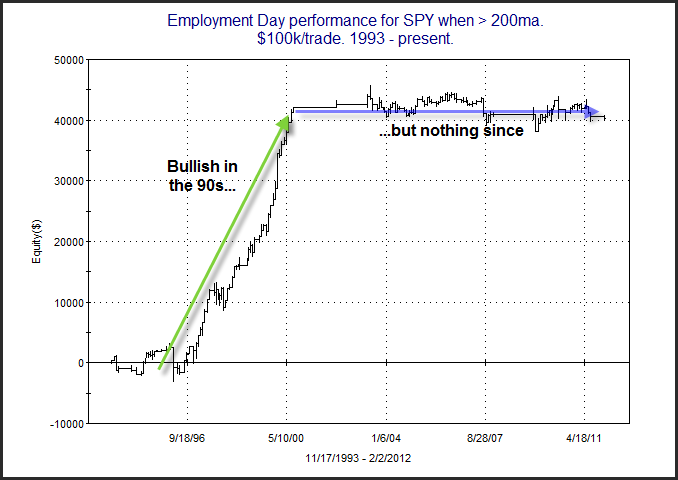
What I find so interesting about the chart is that for a long time Employment Days in uptrends showed a strong propensity for gains. But in 2000 this edge vanished. Since then there has been no apparent advantage – bullish or bearish.