Wednesday on Twitter I noted that the Quantifiable Edges Capitulative Breadth Indicator (CBI) has begun to perk up. It closed at 8 on Wednesday. I have historically viewed readings of 10+ as bullish. But even getting near that will often generate an upside edge. The study below is from last night’s subscriber letter. It looks at other times SPX closed at a 20-day low & above the 200ma, and the CBI read 8 or 9.
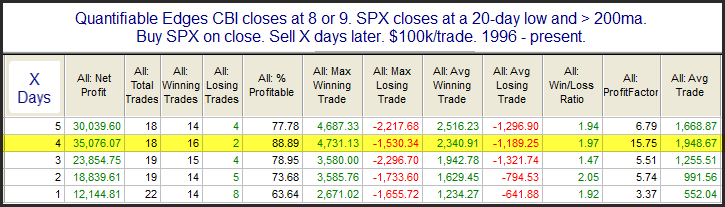
The stats appear solidly bullish. Below is a look at a profit curve that assumes a 4-day holding period.
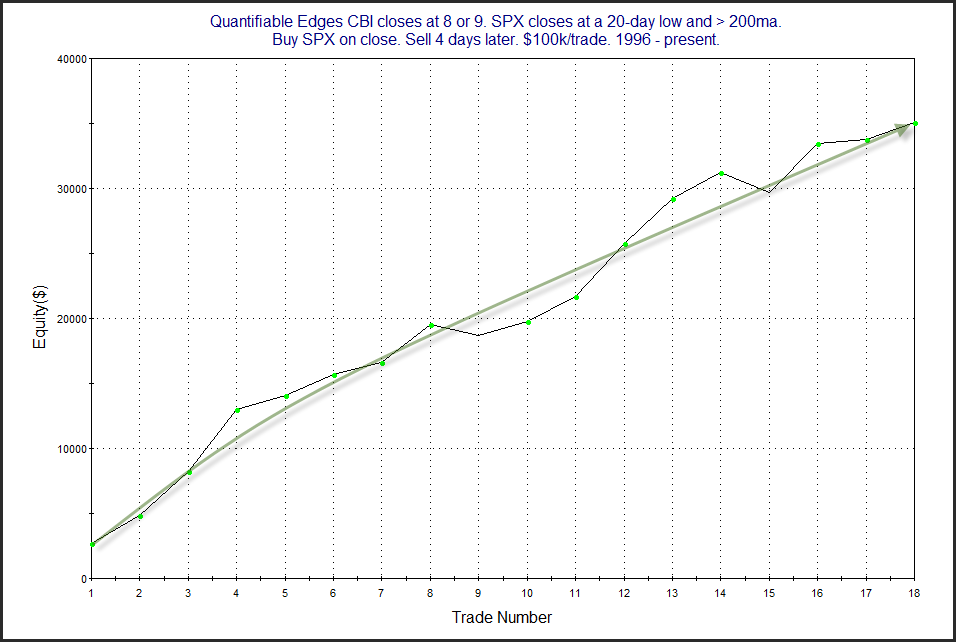
That is a fairly straight shot from lower left to upper right. Falling a little short of a CBI reading of 10+ still seems to have led to very positive performance under similar circumstances. Traders may want to keep this in mind when setting their market bias.
I will also note that another down day on Thursday could see the CBI reach 10. That is not a magical level, but it has been a good indication over the years that a bounce is likely within a few days.
Want research like this delivered directly to your inbox on a timely basis? Sign up for the Quantifiable Edges Email List.
How about a free trial to the Quantifiable Edges Gold subscription?