I’ve written an awful lot about the Quantifiable Edges Capitulative Breadth Indicator (CBI) here on the blog. The CBI moved up from 8 to 15 on Friday. While 10 has been a strong indication for a short-term bounce, 11 or higher has been a reliable indication for the intermediate-term. This is something I showed on the blog last December. Friday was just the 24th time the CBI reach as high as 11. Looking out 20 days later, every other instance has been trading higher. Below is the full listing of triggers and the 20-day results.
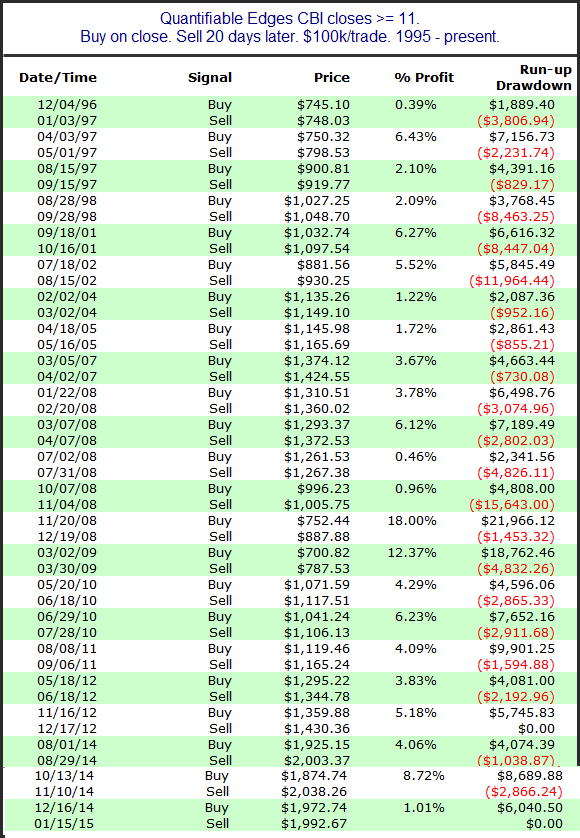
As you can see, SPX has been a perfect 23-0 when looking out 20 days from the first CBI reading of 11+. Drawdowns have been sizable in some cases. Still, it appears a reading of this magnitude often suggests a washout is in progress that should set the stage for at least a multi-week bounce. We may not reach the “final” bottom here, but this study indicates a good chance at least a temporary bottom forms soon.
A detailed description of the CBI can be found here. Or click here for more research related to the CBI.
Want research like this delivered directly to your inbox on a timely basis? Sign up for the Quantifiable Edges Email List.