I have discussed some lately that the market is acting outside of historical norms. Thursday’s action reinforced that. The pullback has come so fast and been so extreme that it is going beyond even many of the most extreme moves in similar situations. For instance, I looked back to 1960 with the SPX for to find other times SPX closed down > 10% from a 250-day closing high within 2 weeks of that high. Thursday marked the 1st time this has ever happened. If I loosened the criteria to a 9% drop from a 250-day high within a 2 week period, then there were 2 instances. They occurred in 1980 and 1986. Below are charts of them.
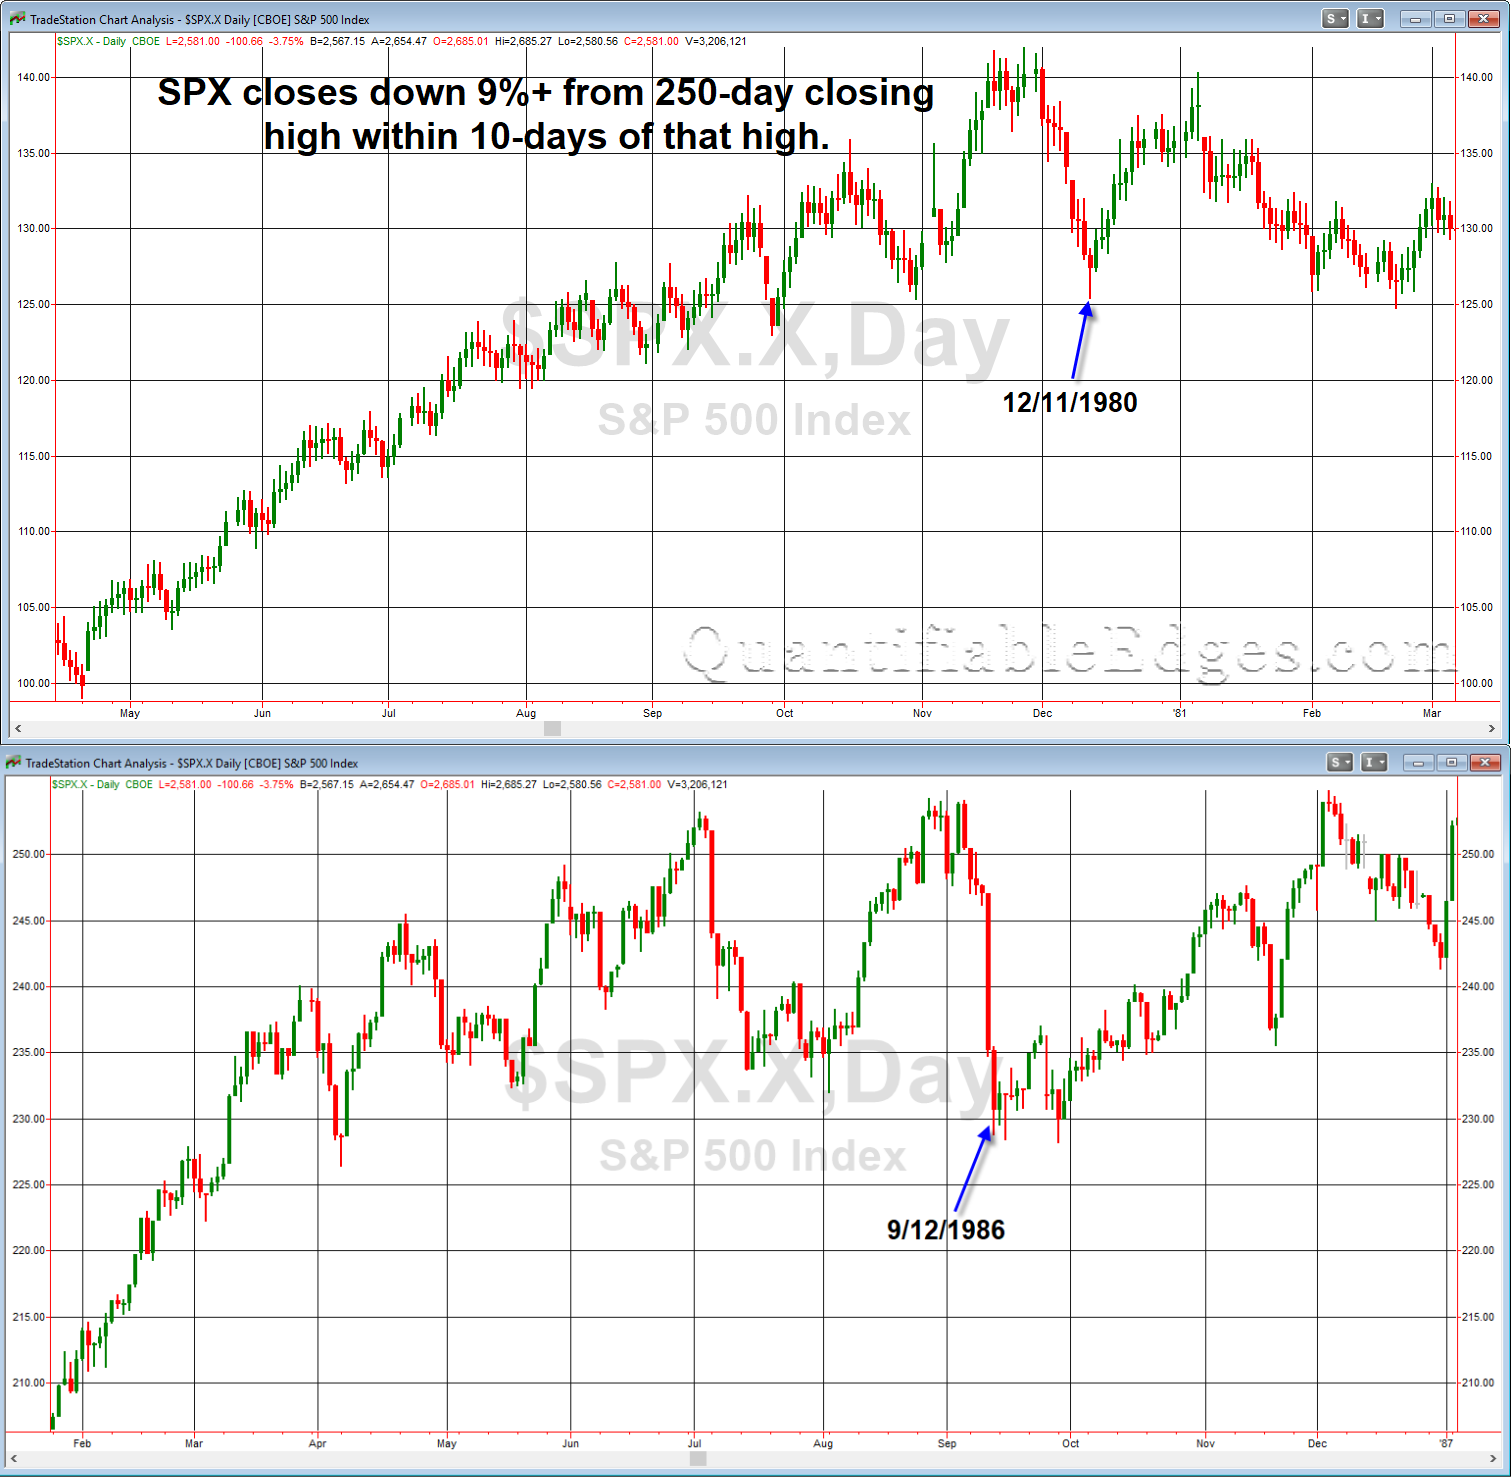
I don’t read too much into just two instances. They did both bounce in short order, but more significant to me is that SPX is doing something it has never done before with the 10% drop from a 250-day high within 2 weeks. Running the same test on the Dow I found only 2 instances. They occurred in 1928 and 1933. So you need to look back 85 years to see such a sharp drop from a high level.
Trading based on historical probabilities becomes more difficult when the market does not comply to historical norms. And when action is so extreme (115% 1-day VIX moves, 10% drops from all-time highs within 2 weeks, etc) that there are little or no comparisons, then keeping some powder dry and not blowing up your accounts becomes more important than timing entries perfectly. It is tough to quantify risk in a market like this. While a strong bounce in the next few days appears highly likely, using too much leverage may not allow an account to survive a few days. Stay in the game. Trade well.
Want research like this delivered directly to your inbox on a timely basis? Sign up for the Quantifiable Edges Email List.