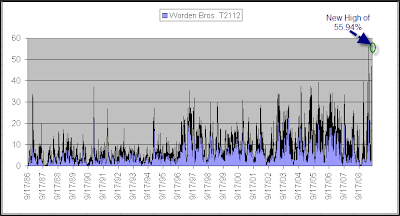
I almost showed a bullish study this morning for all the bulls who’ve been screaming for one. But when an indicator like T21112 hits a new all time high, it deserves a mention. T2112 measures the percent of stocks that are trading at least 2 standard deviations above their 40-day moving average. It set an all time-high in May and I noted it then. It went on to peak 2 days later (May 6th). After that the market experienced a 3-day pullback and a bit of a consolidation.
Monday it barely broke the old record. To provide some perspective as to how extended this indicator is I’ve shown below the full history going back to 1986.
(click to enlarge)
Spikes anywhere near what we are seeing now have been unsustainable in the past. This would seem to suggest a pullback is likely. (Of course, as the bulls will point out – there have been a lot of things suggesting that lately and the market has ignored most all of them.)
P.S. I also noticed T2112 got a mention from Cobra in his last commentary.

