I saw the other day that UBS is launching 12 new VIX-based ETFs. Today I thought I’d show some interesting charts of VXX (IPath short-term VIX) and XIV (VelocityShares Inverse VIX short-term). These are not run by UBS, but they do use a similar approach to the UBS ETFs that are coming out.
Trading volatility can be exciting and there are some terrific swings available for short-term traders. Just Friday VXX rose 9.5%. But if you think these ETFs may be suitable buy-and-hold vehicles, the charts below may change your mind.
The 1st chart is a % change chart of XIV, the inverse VIX vehicle. It goes from the 11/30/10 inception through 9/9/11. After 6 months or so it began garnering some major attention and there were lots of articles written about it. And rightly so, since it posted gains of over 100%…
…but if you had bought at the inception and held through 9/9 you would have seen your investment rise by over 100% and then lose all its profits and now be down over 30%. That isn’t a pleasant ride. (Also interesting is that XIV did a 10-1 split in June when shares were near $170.)
Now let’s look at VXX. VXX has risen over 125% since hitting its low in early July. But let’s look at a % change chart over the same time frame as XIV to see how it has done during the last 10 months or so.
Even with the massive rally since July, an investment made on 11/30/10 would be down 7%. And if we go back to VXX inception?
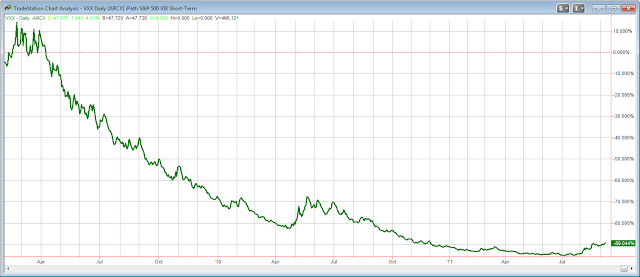
The massive 2-month rally doesn’t look like much on this chart. Since VXX’s inception in 2/2009 it is down about 89% despite more than doubling in the last 2 months.
Some of the reason for the long-term failure of these ETNs is due to expenses, but much of it is thanks to the impact of backwardation and contango when they do daily rolls, as well as the mathematical difficulties in overcoming large drawdowns. (A 50% loss needs a 100% gain to break even. A 75% loss needs a 300% gain…)
I won’t get into backwardation/contango issues here, but below I have listed a few places you could learn more. The bottom line is that these products can be terrific trading vehicles, but 1) you need to understand them and 2) as I hope was clearly demonstrated in the charts above, buy and hold is typically not a good strategy.
Other sources of information:
I did a series of webinars for Quantifiable Edges subscribers on our members site a few months ago that explain backwardation and contango in detail and how they relate to these products. They are archived on the “Videos” page of the members site and the first one of these is even available to trial members. (Click here for trial subscription.)
Another good source of information is Bill Luby’s VIX and More site. Below are a couple of links to posts on his site that will get you started.
https://vixandmore.blogspot.com/2009/05/vxx-calculations-vix-futures-and-time.html
https://vixandmore.blogspot.com/2011/08/vix-term-structure-evolution-over-last.html


