The last day of the year used to be consistently bullish for the market. But that has changed since the turn of the century. This is true across a number of indices. The most dramatic example is the NASDAQ, which I highlighted here on the blog a few years ago. I have updated the chart below.
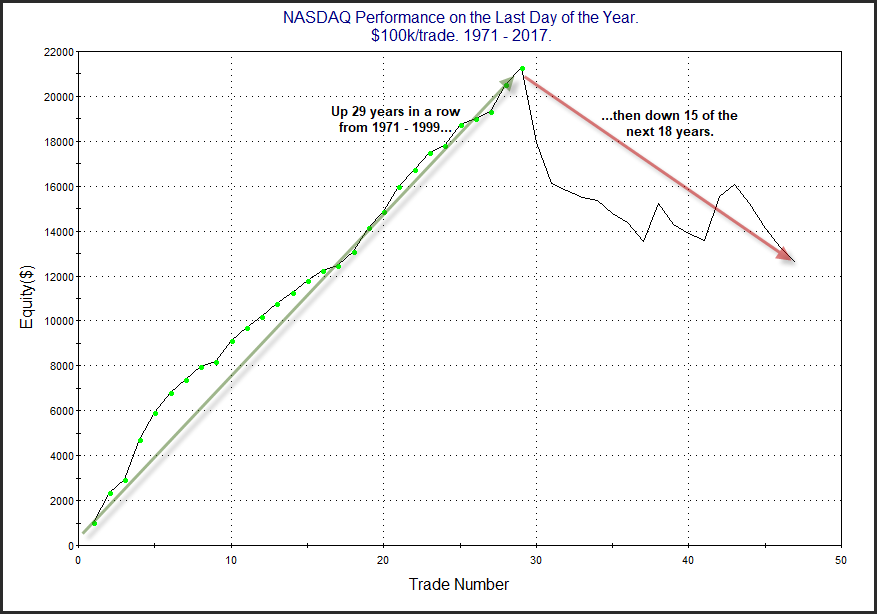
Closing up 29 years in a row is fairly astounding. Just as astounding is the abrupt reversal and move lower for 15 of the next 18 years. I have no good explanation for why such a formerly consistent edge changed, but it did.
This Nasdaq study is a great reminder though. The market is constantly changing and evolving. 2019 is just a few trading hours away. I’m not sure what it has in store for us, but I know it will play out in its own unique pattern. We will see clues along the way, and many of the truisms we’ve identified through studies over the last 11 years at Quantifiable Edges will continue to work. But some may flounder. And when something stops working, like the “last day of year bullishness” above, then I will do my best to recognize it early. Examining edges is more than just running numbers. Researches and traders need to keep an open mind, understand the market is continually evolving, and adapt. Best to all in 2019! I hope it is a prosperous year for you and I hope Quantifiable Edges proves helpful along the way!
Want research like this delivered directly to your inbox on a timely basis? Sign up for the Quantifiable Edges Email List.