When volatility spikes and the market goes into a freefall, anticipating a reversal can be very difficult, but also very rewarding. My favorite tool for capturing potentially monster reversals under such stressful market conditions is the Quantifiable Edges Capitulative Breadth Indicator (CBI).
Now, after sharing studies for 10+ years about the CBI, I have put together a detailed research paper on it! The paper includes updated and new studies, as well as comprehensive stats and charts of every significant CBI spike since 1995.
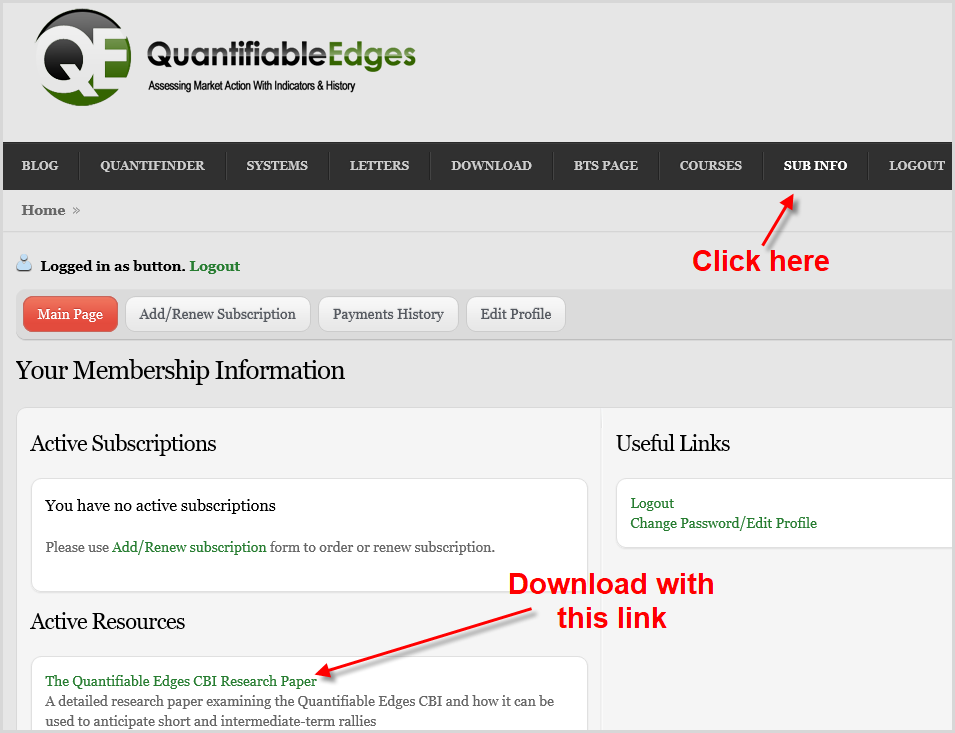
The research paper is available for free download by all registered users at Quantifiable Edges. (Anyone that has ever bought anything or signed up for a free trial or registered for our free downloads. In other words, anyone with a username and login.) If you do NOT qualify, but would like to get a copy of the CBI research paper, you may sign up for a Free Trial, or register for our Free Downloads.
If you already have a username and login at Quantifiable Edges, just login and follow the simple instructions below to download the Quantifiable Edges CBI Research Paper. I hope you find it to be a useful resource as we monitor CBI readings and market action going forward!

