The Quantifiable Edges Capitulative Breadth Index (CBI) closed at 7 on Thursday. For years I have viewed 7 and 10 as key CBI levels. A CBI of 7 has generally suggested a decent upside edge, while 10 or higher has suggested a strong upside edge. The CBI will only typically rise to levels of 7 or higher during sharp market pullbacks. I decided tonight to examine results following CBI readings between 7 and 10. But tonight for the first time I am breaking out results by whether the market is above or below its long-term moving average.
First let’s look at times, unlike the present, when the SPX was trading below its 200ma. The stats table below looks at returns assuming you bought the close on a day where the CBI registered at least a certain number. The exit signal occurred when the CBI dropped back down to 3 or below.
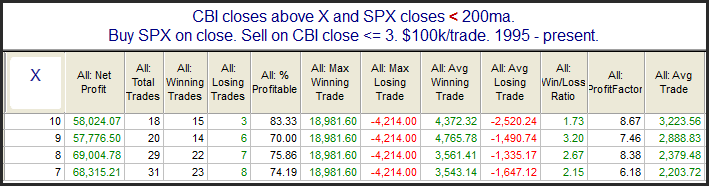
Results here are strong across the board. Most traders would agree that it might make sense to wait for a CBI reading of 10 or higher, rather than enter early with a CBI of 7. While there are 42% less trades, 85% of the net profits are still realized by waiting for a reading of 10, rather than using 7 or higher as an entry signal.
Now let’s look at times like the present, where the CBI is spiking but the market is still above its 200ma.
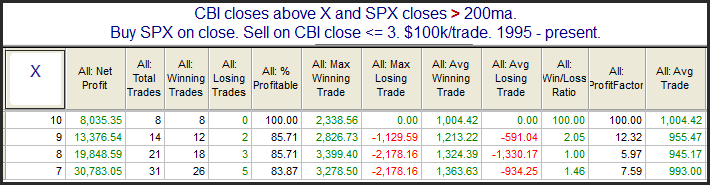
There are few things to note here. First the average trade is much lower than you see when the market is < 200ma. This is primarily because volatility is generally higher during bear markets. What's interesting is that there has been the exact same number of instances where the CBI reached seven or higher (31), but while the CBI has reached ten 18 different times when below the 200ma, it has only managed it 8 times above the 200ma. And with the average trade being almost identical regardless of whether you use 7, 8, 9, or 10, in the long run you would have made nearly 4x as much by using 7 as your trigger rather than 10.