The SPY fell over 2% yesterday. Below is a simple study that looks at SPY performance follow all 2%+ drops while the market is above the 200ma.
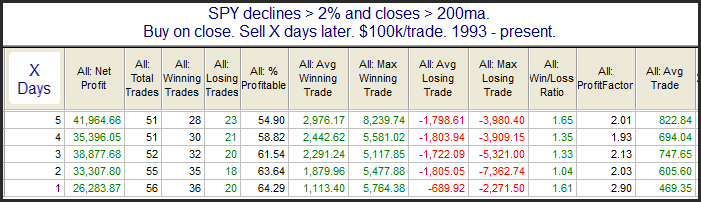
The stats table is impressive and suggests a solid upside edge. But there is a problem with this study that can’t be seen in a stats table. It hasn’t worked well lately. To illustrate this I have broken it into 2 studies below. This first one shows the 1993 – 1999 period.
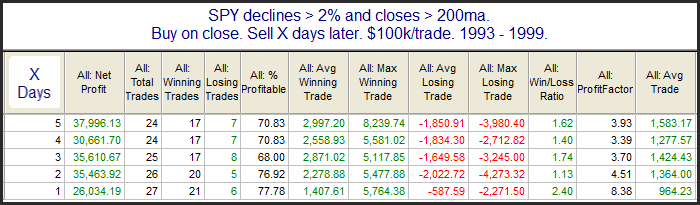
Extremely strong edge suggested here. But then market behavior changed. Here is 2000 – present.

No edge suggested here. Market dynamics are always changing. Sometimes for reasons we can explain, and sometimes not. In either case, when you use edges in setting your bias, it is important to make sure those edges have held up in recent times as well.