A couple of weeks ago I did a little study that looked at performance following the induction of a new Fed Chairman. With Jerome Powell starting his new job on Monday, I decided to expand on that study below.
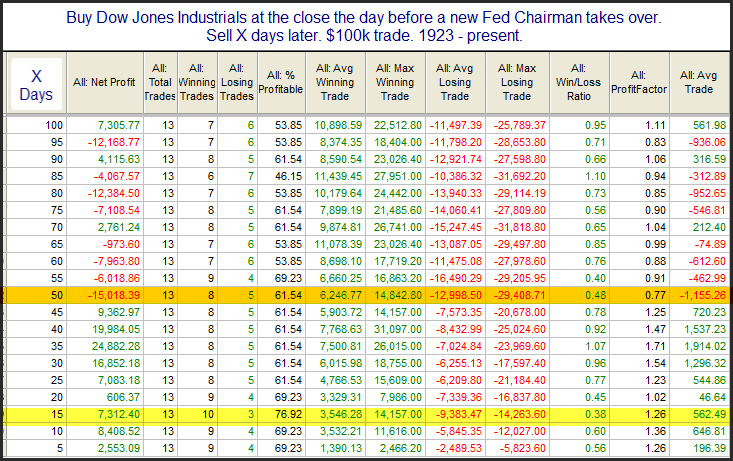
Obviously it appears to be a bit of a mixed bag. The most positive results came in the 1st 3 weeks (15 trading days). Perhaps the market view the new chairman with enthusiasm. The most negative results were 50-day out. These were also greatly skewed by the crash of ’87 and another giant swoon in 1930. Below I have listed the 13 new chairmen and the results 15 and 50 days after their start.
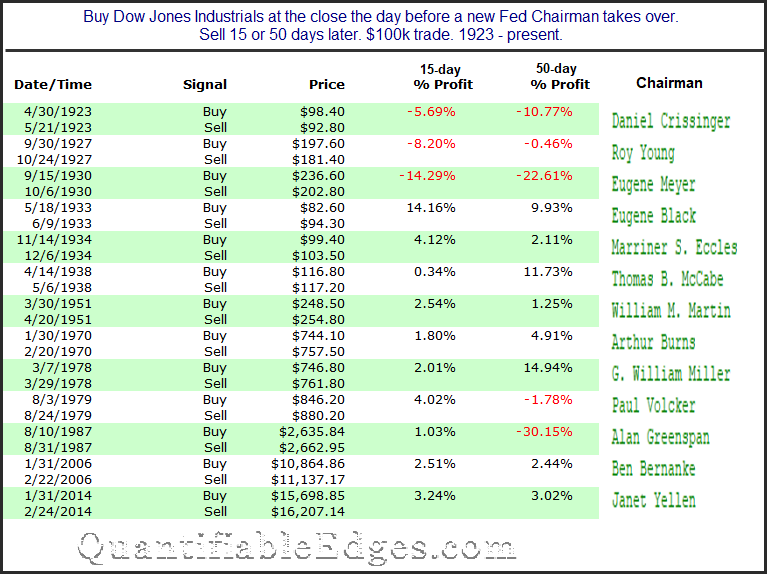
As I mentioned a few weeks ago, what stands out to me is that the last 10 instances all saw the Dow higher 15 days later. Looking back as far as I am and using such a low sample size, I do not view these results as significant. But as an exercise in curiosity I found it interesting.
Want research like this delivered directly to your inbox on a timely basis? Sign up for the Quantifiable Edges Email List.