In the 2/3 blog I examined the “January Barometer”.
As a super-quick review, the January Barometer suggests that a positive January will very often be followed by the next 11 months closing out the year positively. A down January (like we had this year), has led to more inconsistent returns. Use the link above for the details.
When I ran that test I also looked at other months. What I found was that a strong February actually predicted a strong next 11 months better than any other month. Below are the February results.
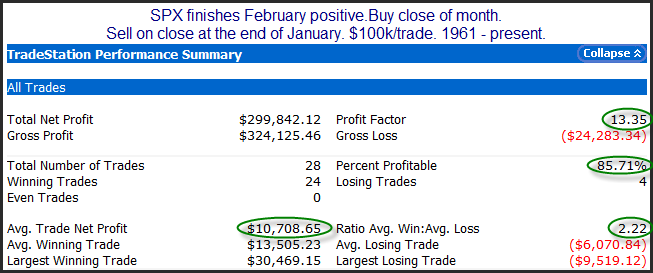
The numbers here aren’t massively better than a “January Barometer”, but if you like using a month as a barometer, February appears to be the best one. And the edge has been even stronger since 1988. Below is the list of instances over the more recent time period.
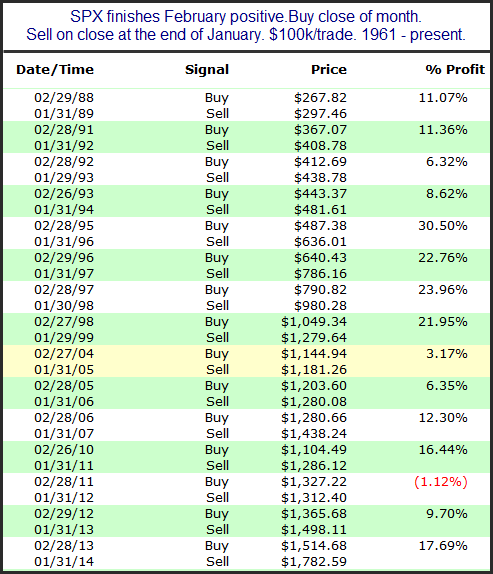
As you can see, 2011 was the only recent loser, with 14 of the last 15 positive Februaries leading to gains over the next 11 months.
This is not a study I plan to rely on for establishing a market bias. I view this more as an academic exercise. A few reasons for this: 1) I don’t like the way the test was developed. I did not start with a reasonable premise and test it. I data-mined to find the best month. This approach does not give me confidence in the results. Some month is bound to be best, and it could be nothing more than random noise. 2) I see no reason that February’s results should be predictive of the next 11 months. You could argue that momentum at this time of year may carry through nicely, but I think that is likely a weak explanation. I suspect this study is only slightly better than the Super Bowl indicator or the Sports Illustrated Swimsuit Cover indicator. But I did find it interesting, so I thought I would share it.
Want research like this delivered directly to your inbox on a timely basis? Sign up for the Quantifiable Edges Email List.