The time around Thanksgiving has shown some strong tendencies over the years – both bullish and bearish. I have discussed them a number of times over the years. In the updated table below I show SPX performance results based on the day of the week around Thanksgiving. The bottom row is the Monday of Thanksgiving week. The top row is the Monday after Thanksgiving.
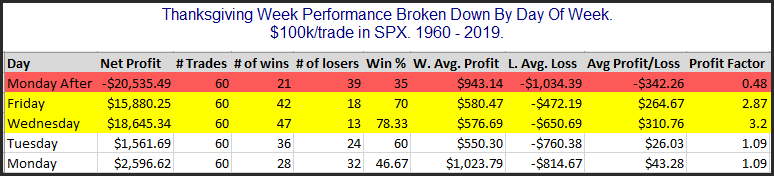
Monday and Tuesday of Thanksgiving week do not show a strong, consistent edge. But the data for both Wednesday and Friday looks quite strong. Both of those days have seen the S&P 500 rise at least 70% of the time between 1960 – 2019. The average instance managed to gain about 0.3% for each of the 2 days. (This is shown in the Avg Profit/Loss column where $300 would equal a 0.3% gain.) That is a hearty 1-day move. Meanwhile, the Monday after Thanksgiving has given back a good chunk the gains that the previous 2 days accumulated. It has declined 65% of the time and the average Monday after Thanksgiving saw a net loss of 0.34%.
Want research like this delivered directly to your inbox on a timely basis? Sign up for the Quantifiable Edges Email List.
How about a free trial to the Quantifiable Edges Gold subscription?