In my last post I looked at the increased volatility based on the size of the average overnight gap in SPY. Today I’ll examine the current market’s volatility based on its Average True Range Percent.
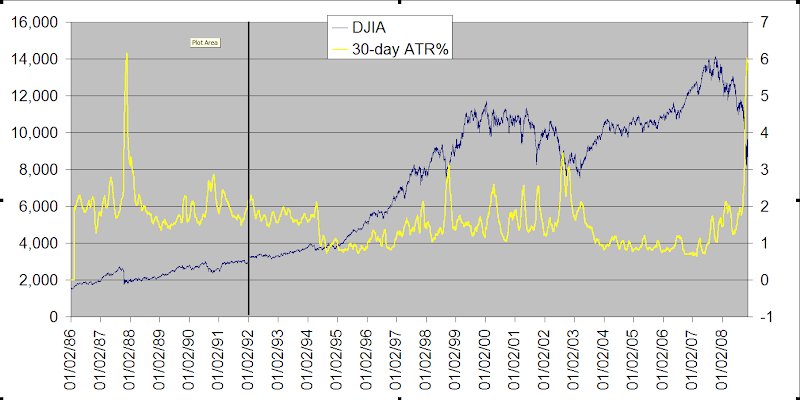
In the chart below I show the Dow Jones Industrial Average from 1986 – present. The yellow line represents the 30-day average true range on a percentage basis. The average true range over the last 30 days closed at an astonishing 6.02% on Wednesday.
Theoretical Dow Jones Index
A method of calculating a Dow Jones index (most often the DJIA) that assumes all index components hit their high or low at the same time during the day.
In other words, the “theoretical Dow” uses the daily highs for all 30 Dow components to calculate the index high, and the lows to calculate the index low. In January of 1992, Dow Jones started using the “actual” method, which calculates the index at 10-second intervals throughout the day. Before this point, the theoretical calculation was the only way to compute the high and low of the index. This method assumes that all stocks hit their high or low at the same time. Because this rarely happens, the theoretical high will almost always be higher than the actual, and the theoretical low will almost always be lower than the actual.
Taking the pre – ’92 exaggerated range into account, it appears almost certain that the recent market has displayed a higher Average True Range % than 1987. Going back further in history, the only other period where ranges approached these levels were…the 1930’s.
You may notice from the charts that the spikes in volatility tend to occur near market bottoms. An ATR spike can alert you that a bottom may be coming. Like many indicators that use moving averages, though, the 30-day ATR% is a lagging indicator. It typically peaks after the bottom has been made. Look for this measure to turn down again once a bottom (at least a temporary bottom) is in place.


