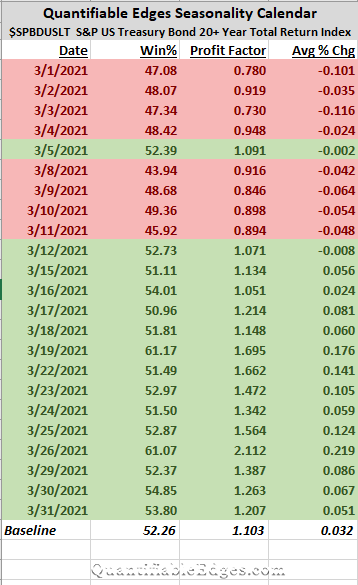
For the next several months, I have decided I will share one of the Quantifiable Edges Seasonality Calendars for the upcoming month. This month the calendar that caught my eye was the US Treasury 20+ Yr Total Return Index. This index is very similar to TLT. It is one of 10 seasonality calendars that we publish at Quantifiable Edges.
Treasuries have been in a big swoon over the last month. TLT closed down 5.7% on a total return basis in February, leaving it down 9.2% so far in 2021. That is a rough start to the year for TLT.
The Quantifiable Edges Seasonality Calendar uses multiple systems to measure historical performance on similar days to those on the upcoming calendar. The systems look at filters like time of week, month, year and so forth. Over the long run, staying out of the market on days that do not appear in green, would have been beneficial. To appear in green the date needs to show a historical Win% of 50% or more and a profit factor of 1.0 or more.

So Treasuries look like they will face a seasonal headwind for much of the first two weeks of March. After that, they may have seasonality on their side. Whether seasonality will matter much in a market that is so overdone right now will be interesting to monitor over the next month. But it is an input that has mattered over the long haul, and traders may want to consider it when forming their trading plan.
Want research like this delivered directly to your inbox on a timely basis? Sign up for the Quantifiable Edges Email List.
How about a free trial to the Quantifiable Edges Gold subscription?
