In the past I’ve discussed how breaks from consolidations are often much less reliable when looking for a reversal than if you hit a new high or low during a trending market. This is because the breakout will often create new excitement in the direction it occurs. Some of that is stops being blown and some of that is from breakout players looking to take advantage of a newly emerging trend.
One way to measure the strength of a trend is with the ADX indicator. It was pointed out to me today by a subscriber that the SPX 14-day ADX was dropping under 12 – which is an extremely low level. (The 14-period reading is the default reading for ADX with most charting packages.)
So using ADX as a measurement of trend strength I created a study that demonstrated low-ADX vs. high-ADX breakdowns, and how the implications were much different. First let’s look at situations like the present where the SPX breaks down and ADX is under 20.
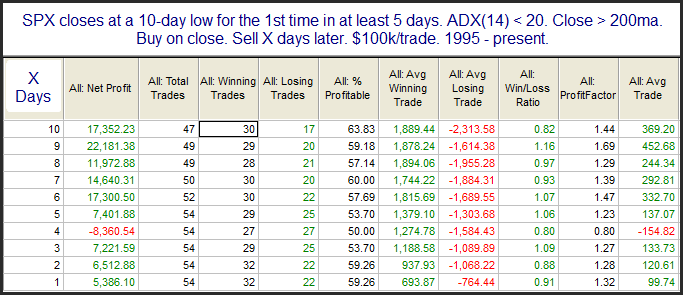
As you can see, there is no substantial edge suggested when you are looking at a sharp move out of a consolidation with a low ADX.
Next I ran a 2nd test. This one used all the same parameters except I required the ADX to close above 20 instead of below it. This suggests the market has been moving instead of meandering. Those results are below.

What we see here are vastly more compelling results.
Unfortunately, with the ADX now just under 12, there does not appear to be a substantial upside edge offered by the break lower.