In last night’s subscriber letter I showed a few studies suggesting the market was short-term overbought in a long-term downtrend, and that there appeared to be a short-term downside edge. Below is one of those studies, which also appeared in the Quantifinder yesterday afternoon.
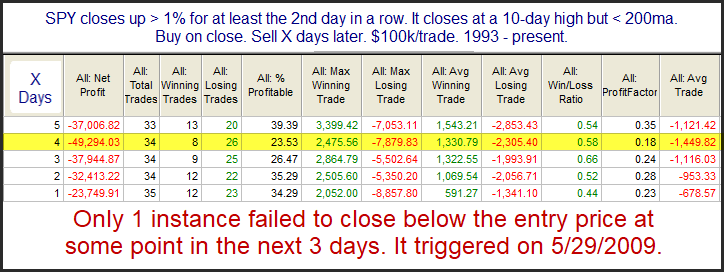
Those are some powerful numbers. And only 1 instance did not post a lower close in the next 3 days. Below is a look at the 4-day profit curve.
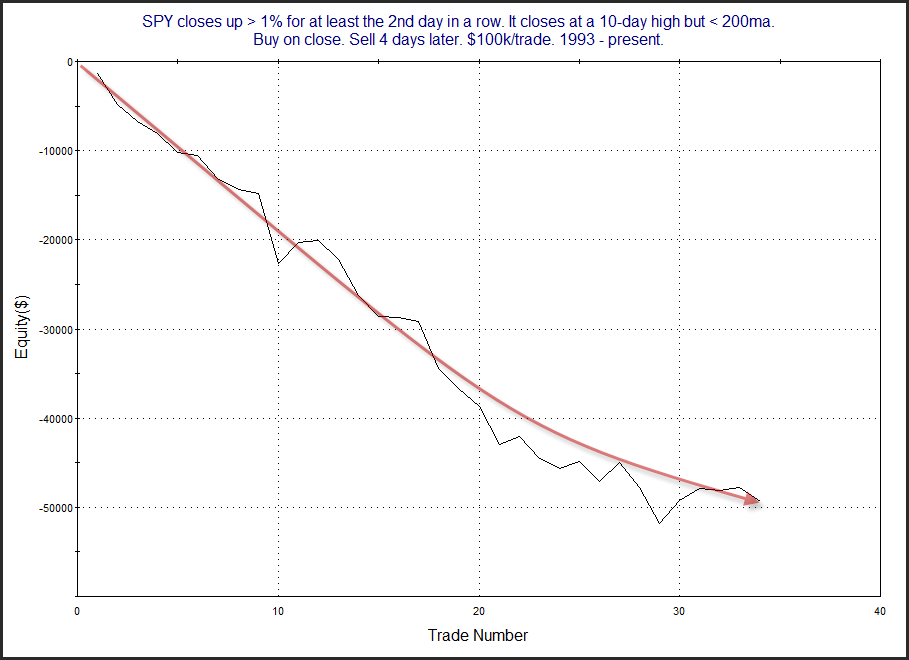
Despite the recent bump up, that is a long, persistent downslope. Traders may want to consider this as they set their market bias.
Want research like this delivered directly to your inbox on a timely basis? Sign up for the Quantifiable Edges Email List.
How about a free trial to the Quantifiable Edges Gold subscription?