Friday we again saw the VIX and VXO (the old calculation for the VIX) close well below their recent mean. Such stretches suggest a collapse in fear among investors. The study below was last seen in the 2/13/14 blog. It looks for stretches in VXO of 15% or more below the 10-day moving average that have persisted for three days.
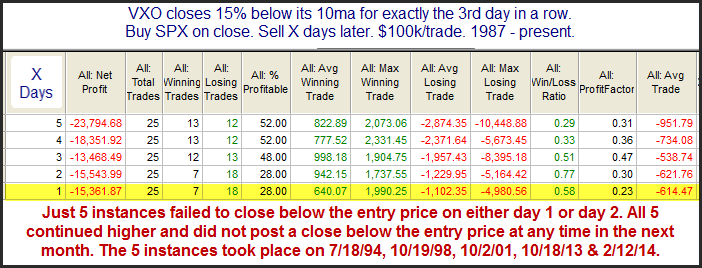
Based on the stats table there appears to be a short-term downside inclination. I find the note at the bottom of the study to be especially interesting. Nearly every case has experienced an almost immediate pullback, but those that didn’t went without pulling back for a long time.
Want research like this delivered directly to your inbox on a timely basis? Sign up for the Quantifiable Edges Email List.